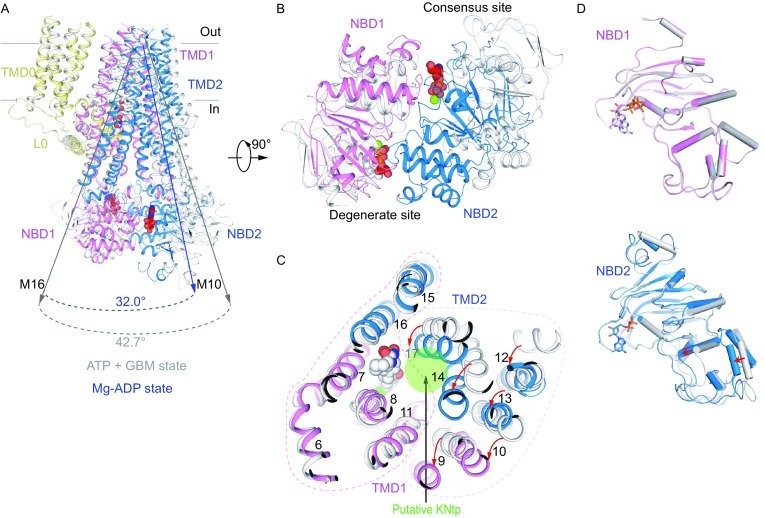
Figure 5.

Conformational changes of SUR1. (A) Superposition of the Mg-ADP bound structure (colored) and the ATP + GBM bound structure (gray) by aligning the TMD0 domain of SUR1. Angles between helices M10 and M16 in the two structures are labeled. Mg-ADP, ATPγS and GBM molecules are all shown as spheres. (B) Bottom view of NBDs of the KATP channel with a 90° rotation relative to (A). (C) Bottom view of TMDs of the KATP channel with a 90° rotation relative to (A). Positional changes of transmembrane helices from the first half of TMDs (M9–10, 12–14 and 17) are indicated by red arrows. The dashed lines specify the two halves of TMDs. The putative KNtp binding site is shown as a green circle, showing the displacement of GBM-binding sites upon nucleotide binding. (D) Structural comparisons of individual NBD1 (top) or NBD2 (bottom) between the ATP + GBM state (gray) and the Mg-ADP state (colored). Conformational changes of α helices-rich subdomain in NBD2 are indicated by red arrows. NBD structures are aligned according to β sheet-rich subdomain
