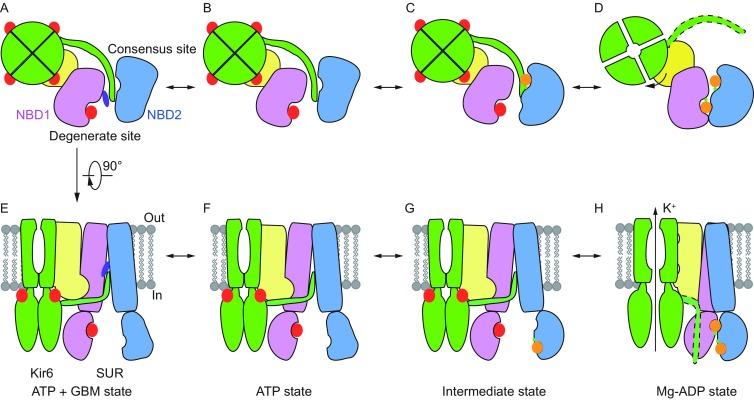
Figure 6.

Model for nucleotide-induced NBD dimerization of the KATP channel. (A–D) Bottom view of SUR1 cartoon models from cytosolic side. For simplicity, only CTDs of Kir6.2 and TMD0-L0 and NBDs from one SUR1 subunit are shown and colored the same as in Fig. 1A. KNtp with an unknown conformation in Mg-ADP state is outlined by dashed lines. ATP and ADP are shown as red and orange big spheres, respectively. Mg2+ ions are shown as green small spheres. (E–H) Side view of SUR1 cartoon models. For simplicity, a pair of Kir6.2 and one SUR1 subunit are shown
