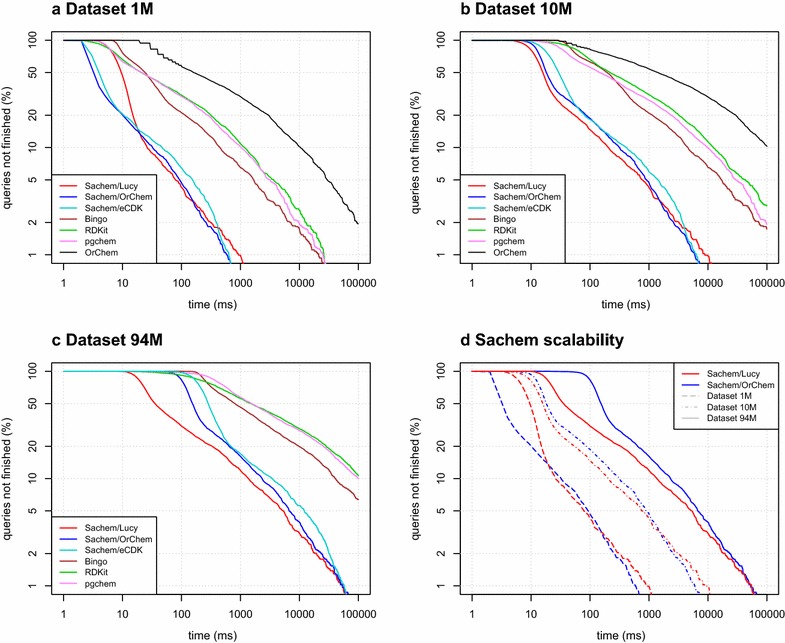
Fig. 3.

Overall performance comparison. Log-times in milliseconds are plotted on the x axis and log-percent of queries that took more than the plotted time are plotted on the y axis. Plots a–c show the performance comparison of Sachem/Lucy and Sachem/OrChem to other benchmarked cartridges on all datasets. The original OrChem was not benchmarked on the largest dataset due to the lengthy time that would be required to finish the benchmark. Plot d is a comparison of timings for Sachem/Lucy and Sachem/OrChem on all datasets that shows the scaling advantage of Sachem/Lucy
