Fig. 1.
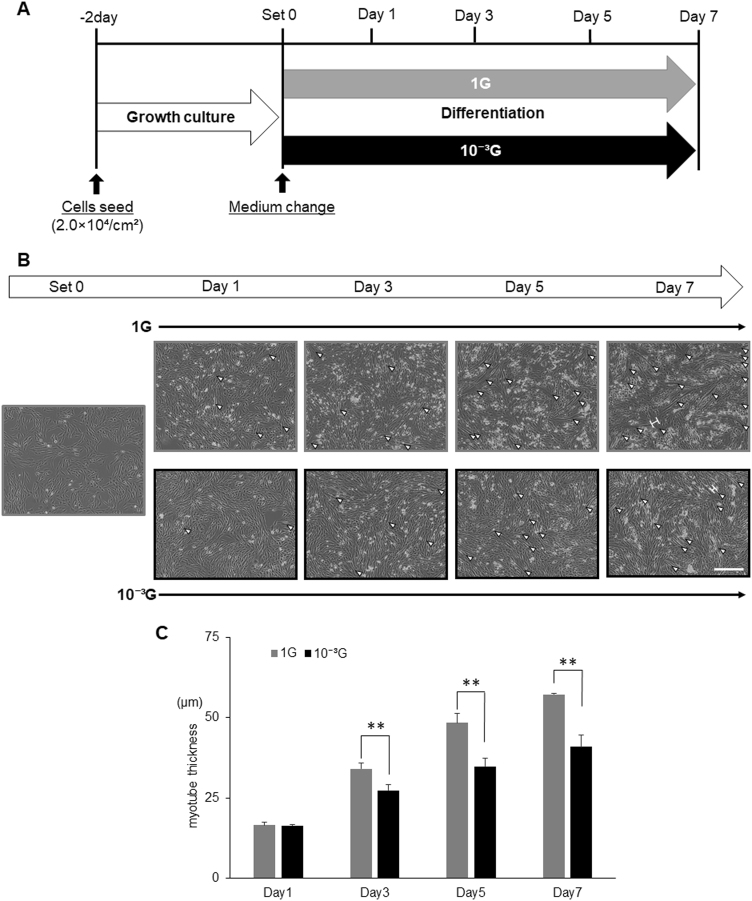
Morphological evaluation of myogenesis under microgravity conditions. a Schematic representation of experimental time course is shown. L6 cells were cultured with growth medium for 2 days, and then replaced with differentiation medium. Cells were then cultured under normal 1 G or 10-3G conditions for 0, 12 h, 1, 3, 5, or 7 days, and observed by taking pictures, and the maximum transverse diameters of myotube cells (myotube thickness) were measured. b Representative microscopic images during myogenesis are shown. White arrow heads: myotube cell; white H-shaped bars: examples of the maximum transverse diameter of myotube cells; white scale bar: 300 μm. c The maximum transverse diameters of myotube cells were measured by image processing software ImageJ, and the mean value of 10 fields was calculated. Columns show the mean of three independent experiments; bars, SD. P values calculated with Student’s t test. (**P < 0.01) (n = 3)

