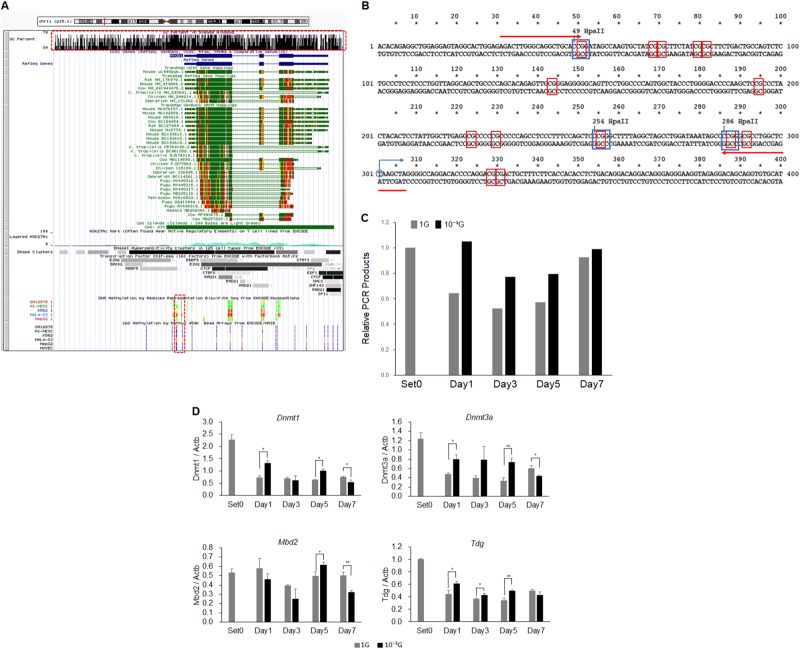
Fig. 4.
DNA methylation in Myod1 gene under microgravity conditions. a Schematic structure of MYOD1 gene in UCSC Genome Browser showed that MYOD1 gene virtually overlapped with CpG island (upper rectangle drawn in red dotted line), indicating very dense CpG sites, and the proximal promoter region contained actually methylated sites (lower rectangle drawn in red dotted line). b The nucleic acid sequence of proximal promoter region in Myod1 gene is shown. Blue circle and arrow indicate transcription start site of Myod1 gene, red rectangles, CpG sites, blue rectangles, HpaII sites, and red arrows, primer sets for modified HELP-assay. c Methylated proximal promoter regions in Myod1 gene are quantified by real-time PCR. Three independent measurements were averaged and relative amounts of PCR products were calculated as the ratio against that of Set0 for each experiment. (n = 3). d Expression levels of methylation related genes were evaluated by real-time RT-PCR. Three independent measurements were averaged and relative gene expression levels were calculated as a ratio against Actb expression for each experiment. Columns show the mean of three independent experiments; bars, SD. P values calculated with Student’s t test. (*P < 0.05, **P < 0.01) (n = 3)

