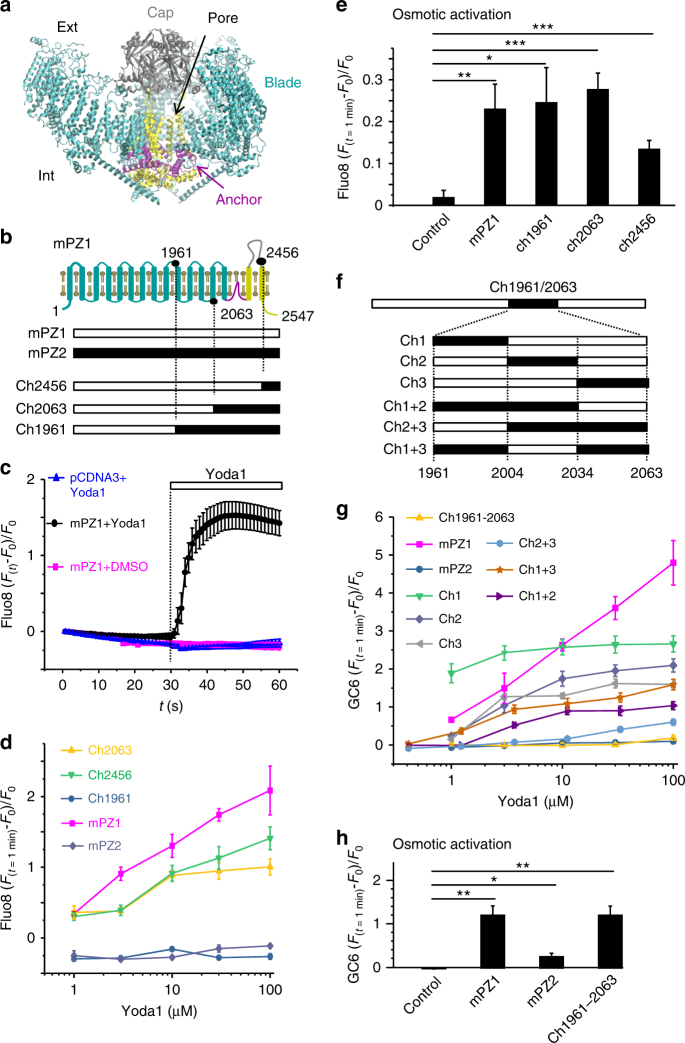
Fig. 1.
Design of a Yoda1-insensitive Piezo1 chimera. a mPZ1 cryo-EM structure (PDBID:6B3R) created using Molecular Visual Dynamics (VMD) with structural features highlighted with differential coloring. b Generation of C-terminal Piezo chimeras with respect to their approximate position with a simplistic mPZ1 topology (coloring identical to a, residues position not to scale). Residue numbers are from mPZ1. c Relative Ca2+-sensitive fluorescence time course in HEK 293T cells transfected with WT mPZ1 (black and magenta traces) or the empty vector pCDNA3 (blue trace). Cells were pre-loaded with Fluo8-AM and incubated with 30 µM Yoda1 (blue and black traces) or a control solution (magenta trace) at t = 30 s. d Relative fluorescence changes from HEK 293T cells expressing the indicated constructs plotted against Yoda1 concentration. e Relative fluorescence changes from HEK 293T cells transfected with the indicated construct or with the empty vector pCDNA3 following an acute hypotonic shock. f Generation of internal Piezo chimeras. Residue numbers are from mPZ1. g Relative changes of Ca2+-sensitive fluorescence measured using GCaMP6m (GC6) for the indicated Piezo channels and chimeric variants and plotted as a function of Yoda1 concentration. h Relative fluorescence changes from HEK 293T cells expressing the indicated construct or the empty vector pCDNA3 following an acute hypotonic shock. In d and g, the experiment was done in duplicate and repeated four times. In e and h, the experiment was done in duplicate and repeated five times and the fluorescence signal was compared to the control using a two-tailed unpaired Student’s t-test. The asterisks indicate standard p-value range: *: 0.01 < p < 0.05; **: 0.001 < p < 0.01 and ***: p < 0.001. In c–e and g, h, error bars = s.e.m

