Fig. 4.
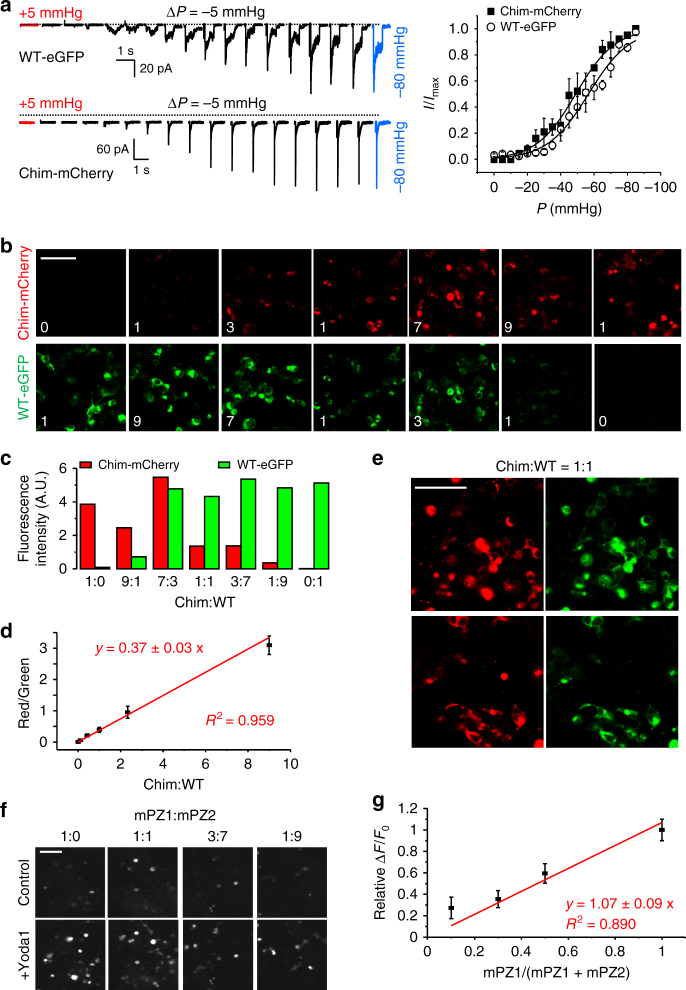
Ratiometric expression of hybrid channels. a Left, pressure-induced ionic current traces from WT-eGFP and Chim-mCherry. Right, normalized peak current plotted against pressure for WT-eGFP (open circles) and Chim-mCherry (full squares). The plots are the average of at least five independent recordings. Dotted lines indicate zero current level. b Example of confocal fluorescence images showing separate eGFP emission (bottom row) and mCherry emission (top row) from HEK 293T cells co-transfected with WT-eGFP and Chim-mCherry. The number in each image indicates the relative proportion of each transfected plasmid. c Histograms showing the fluorescence intensity from images displayed in b for different ratiometric transfections. d Linear fitting of the relative mCherry/eGFP emission (red/green) as a function of the relative proportion of Chim/WT transfected plasmids (Chim:WT). The experiment was repeated three times. e Examples of confocal images from cells transfected with equimolar amounts of plasmids encoding WT-eGFP and Chim-mCherry. The dynamic range of the images has been altered to highlight the co-localization of both fluorescence channels. f Examples of calcium-sensitive fluorescence images obtained using GC6 before (control) or after incubation with 30 µM Yoda1 (+Yoda1) in cells transfected with the indicated ratios of plasmids encoding mPZ1 and mPZ2. g The ΔF/F0 obtained for each ratio tested in f was normalized to the ΔF/F0 obtained in cells transfected only with mPZ1 (relative ΔF/F0) and plotted as a function of the proportion of mPZ1 plasmid in the plasmid mixture (mPZ1/ (mPZ1 + mPZ2)). A linear fit to the data is shown in red. The experiment was done in duplicate and repeated four times. In a, d, g, error bars = s.e.m. Scale bar in b, e, f = 50 µm

