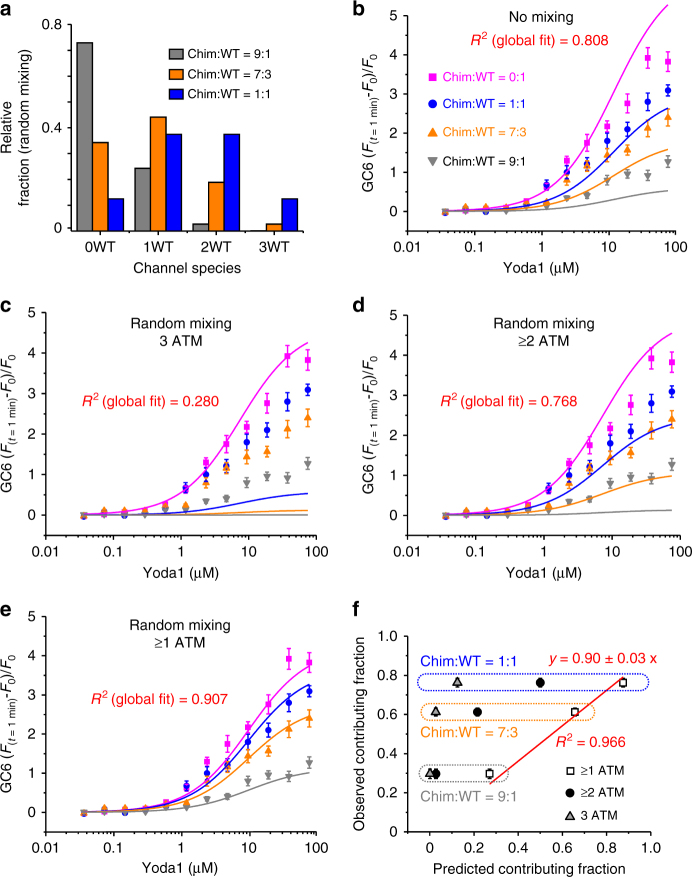
Fig. 5.
Global fitting of Yoda1 dose–responses from hybrid channels. a Predicted distribution of channels species for the indicated Chim:WT ratios calculated using Eq. 5. b–e Yoda1 dose–responses from cells transfected with the indicated Chim:WT ratios (0:1, magenta; 1:1, blue; 7:3, orange and 9:1, dark gray). The experiment was done in duplicate and repeated five times. The data were fitted with four different gating models using Equation 6. In b, the model assumes no subunit mixing, thus the fluorescence signal is predicted to be contributed by WT channels whose relative proportion is identical to the proportion of transfected WT plasmid. In c–e, the models assume random subunit mixing with relative distributions as depicted in a. These models predict that the fluorescence signal is contributed by channels harboring 3 WT subunits (3 ATM) (c), or at least two WT subunits (≥2 ATM) (d) or at least one WT subunit (≥1 ATM) (e) (see Table 1 for more details). f The observed contributing fraction of Yoda1-activated channels is plotted against the predicted contributing fraction of Yoda1-activated channels using Equation 7 and for three different Chim:WT ratios (1:1, blue; 7:3, orange and 9:1, gray). The predicted fractions were calculated assuming random subunit mixing and assuming signal contribution by channels having 3 ATM (gray triangles), at least 2 ATM (black circles) or at least 1 ATM (open squares). In b–f, error bars = s.e.m

