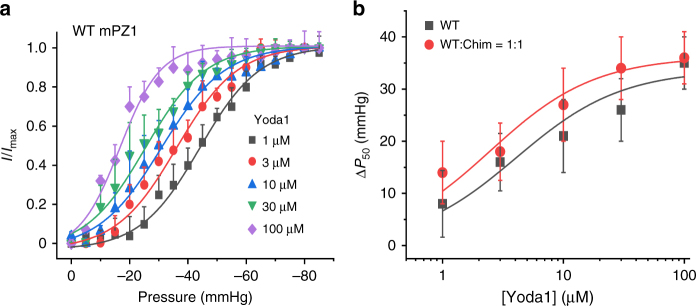
Fig. 7.
Modulation of P50 by varying Yoda1 concentrations. a Normalized peak current obtained using cell-attached pressure-clamp measurements in HEK 293T cells transfected with WT mPZ1 channels and plotted as a function of the pressure pulse for the indicated Yoda1 concentrations in the patch pipette (V = −80 mV). b Plots showing the shift of P50 values (ΔP50) as a function of the Yoda1 concentration measured in cells transfected with WT mPZ1 (dark gray) or with the WT:Chim = 1:1 ratio (red). The dark gray and red lines are a fit to the data using a standard binding equation similar to Eq. 2. In a and b, the plots correspond to an average of four independent experiments and error bars = s.e.m.

