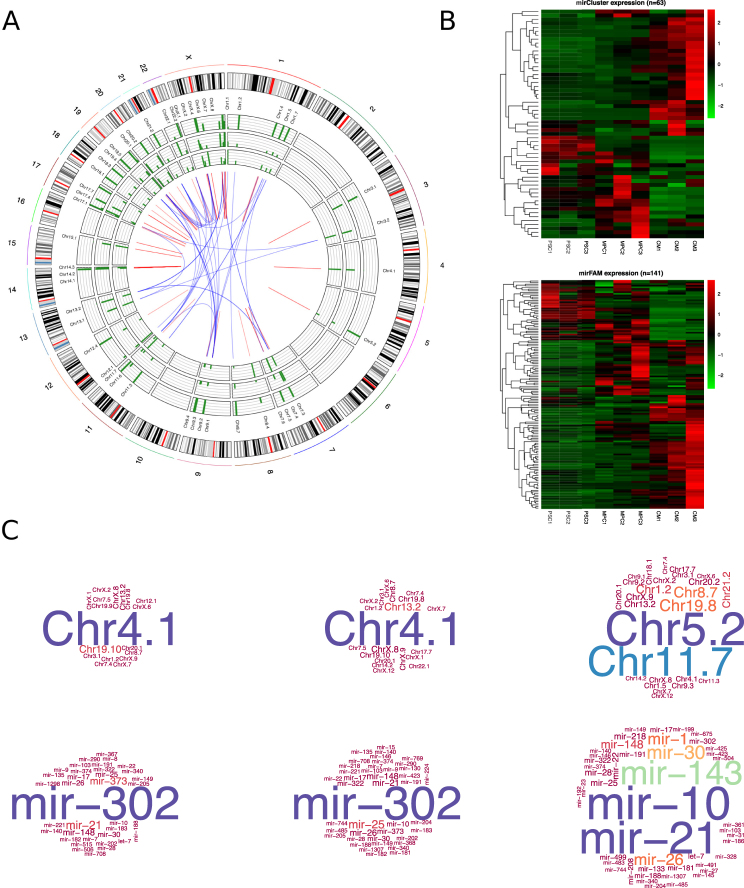
Figure 4.
Analysis of microRNA expression based on Clusters and Families. (A) The Circos plot represents the genome localization of the microRNA clusters. In the outer circle are represented all the chromosomes as a reference for the position of the clusters. The expression level of microRNA clusters in PSC, MPC and CM are shown in the external, middle and inner circles, respectively. In the center red and blue lines represent interconnections of families and clusters, for clusters with microRNAs of only one family or members of more than one family, respectively. (B) Expression level of microRNA clusters and microRNA families are shown in the heatmaps upper and lower, respectively. The analysis was done based on the microRNA expression of the three biological replicates of PSC, MPC and CM. (C) The list of microRNA clusters and families identified in the three cell populations are represented in the top and bottom word clouds, respectively. Bigger letter represents the most highly expressed clusters/families.

