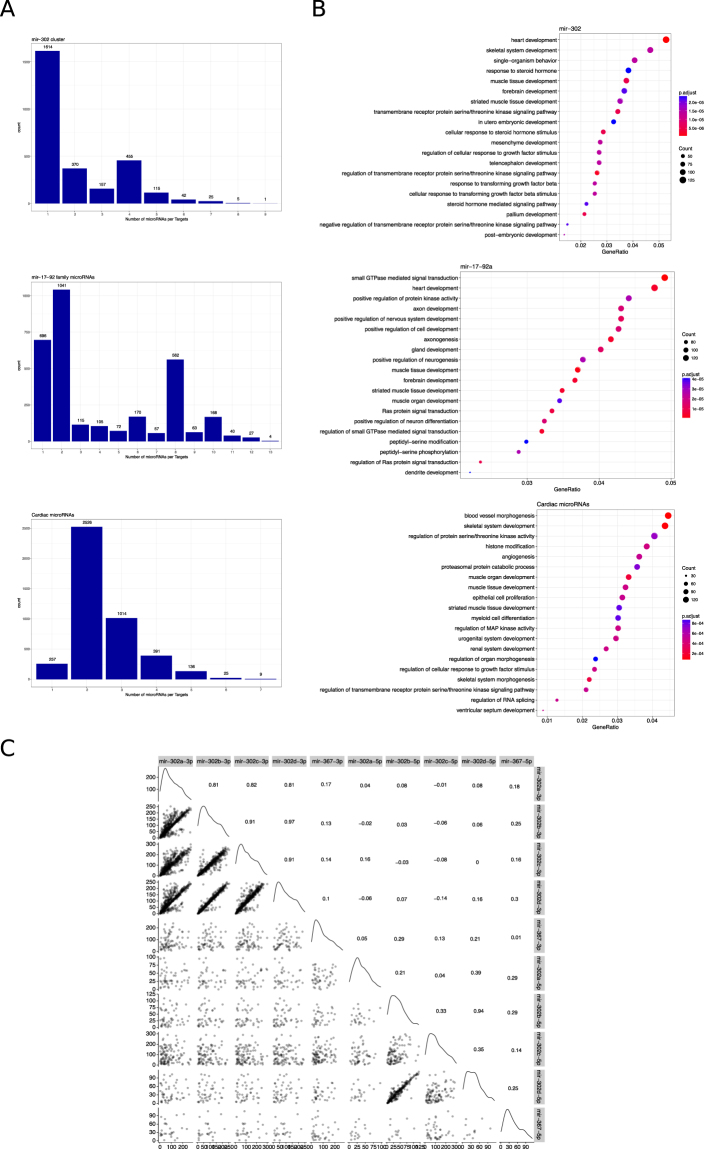
Figure 5.
Target genes analysis from microRNA clusters and families. (A) Graph bars depict the number of genes regulated by the number of microRNAs from clusters Chr 4.1 (miR-302), cluster miR-17-92 and cardiac microRNAs (miR-1, miR-133, miR-208, miR-490, miR-206, miR-499 and miR-143). (B) Gene Ontology (GO) terms from each group of microRNAs are shown in the dot plots. Dot size represents the number of genes included in each GO term and the colorimetric scale is based on the p-value. Gene Ratio represents the number of genes per the total number of genes in each GO term. (C) Correlation between the scores of the predicted targets were analyzed in pairwise for each member of the miR-302 cluster and represented in the scatter plots. Correlation scores are shown in the upper right portion of the graph and in the diagonal line are shown the density plots.

