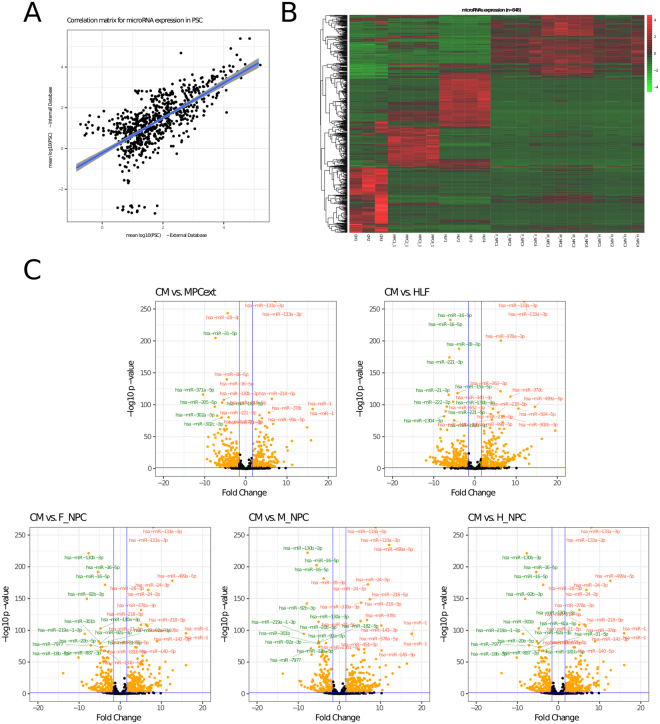
Figure 6.
Comparison of microRNA expression with external data bases. (A) Scatter plot of microRNA expression in PSC (internal database, y axis) and an external database (x axis). (B) Heatmap depicts expression level of microRNAs from 6 cell lines including CM, Mesenchymal progenitor cells (MPC), Human lung fibroblasts (HLF), Forebrain Neural progenitor cells (F_NPC), Midbrain Neural progenitor cells (M_NPC) and Hindbrain Neural progenitor cells (H_NPC) with their respective replicates. (C) Differential expression of microRNAs between CM and the non-cardiac cell lines (external data) are depicted in the Volcano plots. Blue lines delineate the cutoff for microRNAs significantly upregulated (red) and downregulated (green) with a log2 FC ≥ 3 and p ≤ 0.01. Names show the most extreme microRNAs.

