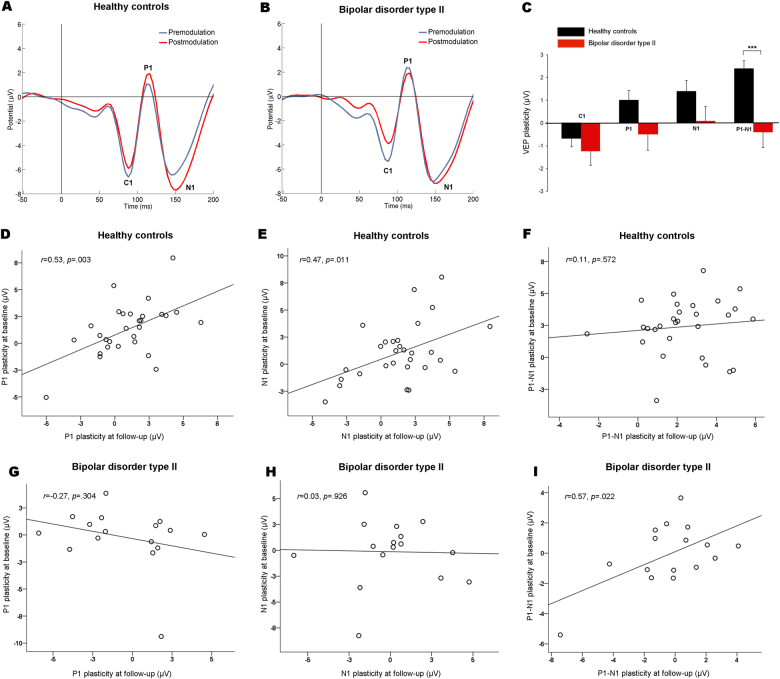
Fig. 2. VEP plasticity of the longitudinal sample at follow-up.
a Grand average premodulation (blue) and postmodulation (red) VEP in controls (n = 29). The modulation block resulted in significant plasticity of the P1, N1, and P1–N1 amplitudes. b Grand average premodulation (blue) and postmodulation (red) VEP in patients with BD type II (n = 16). There was no significant P1, N1, or P1–N1 plasticity in the patient group. c P1–N1 plasticity was significantly reduced in patients with BD type II relative to controls. There was no significant group difference in C1 or N1 plasticity; however, there was a trend toward reduced P1 plasticity in patients (p = 0.07). The group difference in P1–N1 plasticity remained significant after controlling for cortisol, premodulation amplitude, and educational level. ***p < 0.001. Error bars represent the s.e.m. d Temporal stability of VEP plasticity in controls and patients with BD type II. There was a significant positive correlation between baseline and follow-up P1 plasticity and e N1 plasticity, but not f P1–N1 plasticity in controls. g There was no significant correlation between baseline and follow-up P1 plasticity or h N1 plasticity, however, i there was a significant correlation for baseline and follow-up P1–N1 plasticity in patients with BD type II.VEP, visual evoked potential. BD, bipolar disorder

