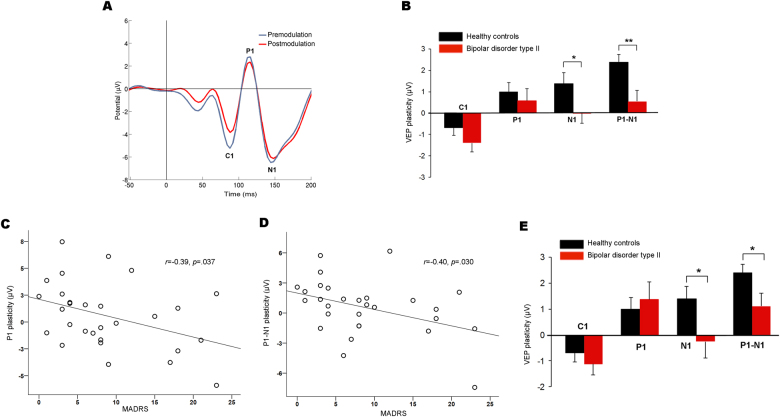
Fig. 4. VEP plasticity of the cross-sectional sample at follow-up.
a Grand average premodulation (blue) and postmodulation (red) VEP in patients with BD type II (n = 29). In contrast to controls, there was no significant P1, N1, or P1–N1 plasticity in the patient group. The VEPs for the controls are shown in Fig. 2a (the longitudinal and cross-sectional sample at follow-up was identical. b N1 and P1–N1 plasticity were significantly reduced in patients with BD type II relative to controls. P1–N1 plasticity remained reduced in patients after controlling for saliva cortisol and premodulation amplitudes. *p = 0.04 **p = 0.005. Error bars represent the s.e.m. c There were significant negative correlations between P1 plasticity and MADRS score and d P1–N1 plasticity and MADRS score in patients with BD type II, indicating stronger impairments in plasticity in more severely depressed patients. e N1 and P1–N1 plasticity were significantly reduced in euthymic patients with BD type II (n = 19) relative to controls; these reductions remained significant after controlling for saliva cortisol and premodulation amplitudes. *p < 0.05. Error bars represent the s.e.m. VEP, visual evoked potential. BD, bipolar disorder. MADRS, Montgomery–Asberg Depression Rating Scale

