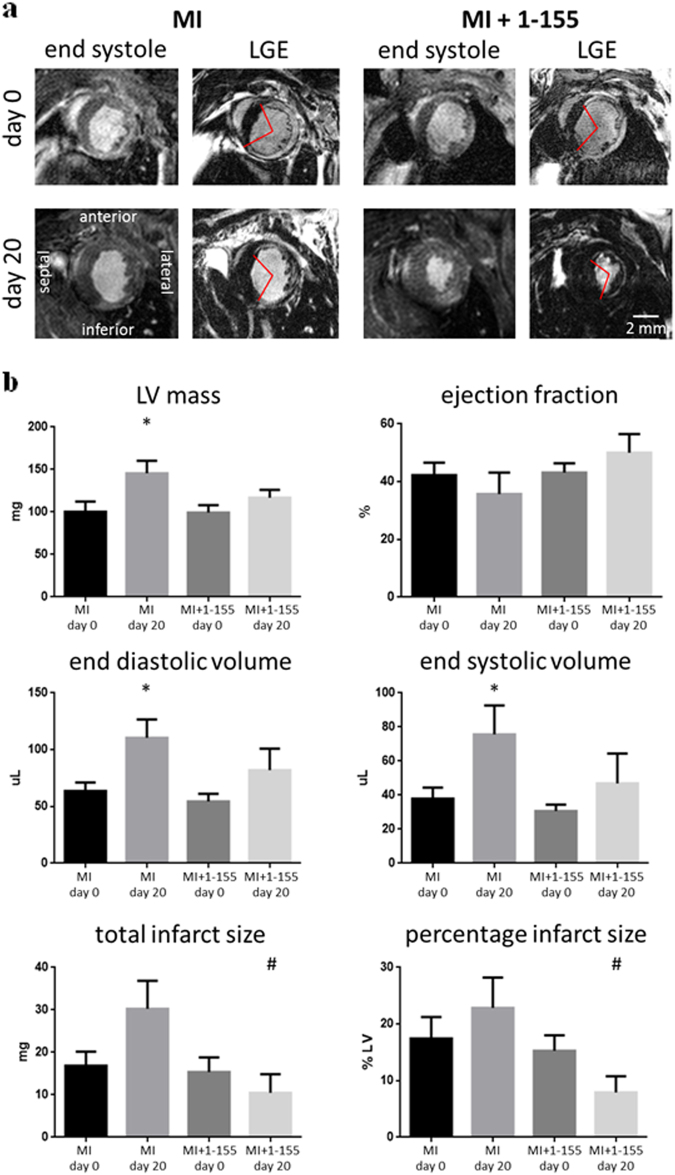
Fig. 2. In vivo assessment of cardiac structure, function and viability in a mouse AMI model following TG2 inhibition.
MRI was performed 6 h after myocardial infarction, prior to mini-pump implantation, and again at 20 days. a Representative end systolic frames of cine-MRI acquisitions along with matching late gadolinium-enhanced MRI (LGE) acquisitions used for assessment of infarct size. Red lines define the edges of the hyper-enhanced infarct region. b Left ventricular masses, end diastolic volumes and end systolic volumes increased from day 0 to day 20 in the control group, but there was no significant increase in these parameters in the treatment group. Total infarct size and infarct size as a percentage of left ventricular mass was significantly lower in the treatment group compared with controls at 20 days. *P < 0.05 compared with day 0; #P < 0.05 compared with control. Bar = 2 mm

