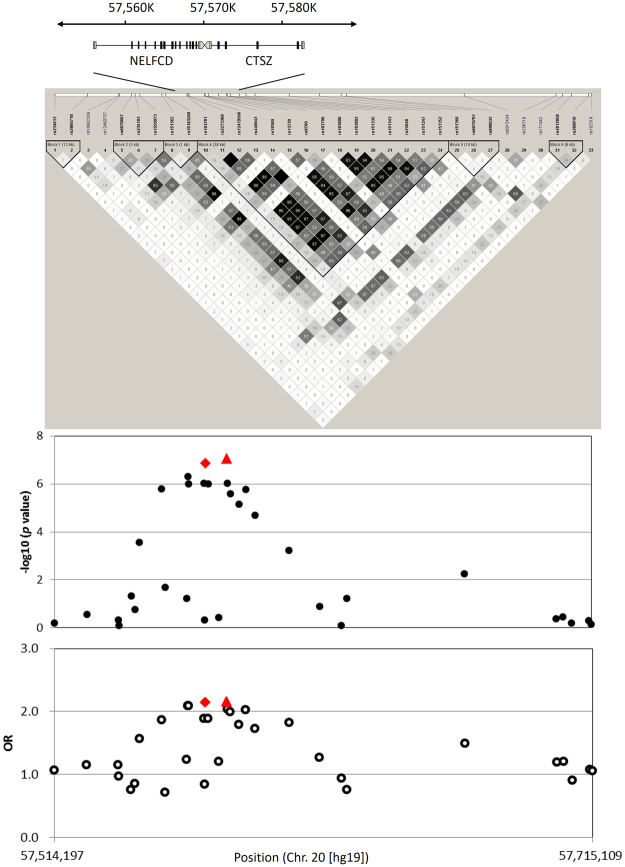
Figure 2.
High-density association mapping at NELFCD and CTSZ loci. The top panel shows estimates of pairwise r2 for 33 SNPs used in the high-density association mapping at NELFCD and CTSZ loci (chr 20, nucleotide positions 57514197–57715109, hg19) using a total of 1,375 samples including 173 jaundice-stage and 1,202 early-stage PBC patients. The bottom panel shows P values (●) and OR (○) based on chi-square tests for the allelic model. Red diamond ( ) and red triangle (
 ) show rs13720 and rs163800, respectively.

