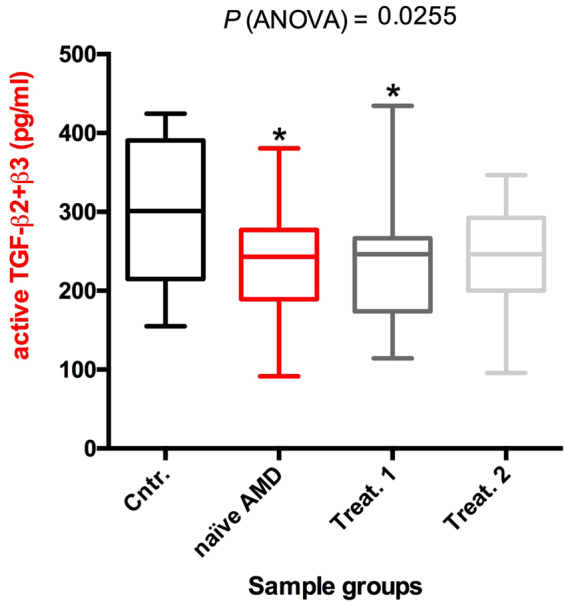
Figure 3.

Box and whisker plot showing the sum of TGF-β2 and TGF-β3 concentrations for every single sample (derived from dataset of Fig. 2). Data are presented as box and whisker plots displaying the median, lower, and upper quartiles (boxes) and minimum-maximum (whiskers). Asterisks indicate significant differences (*P < 0.05) between naïve or treated (once or twice, Treat.1 and Treat.2, respectively) patient groups and the control group (Cntr.).
