Fig. 1.
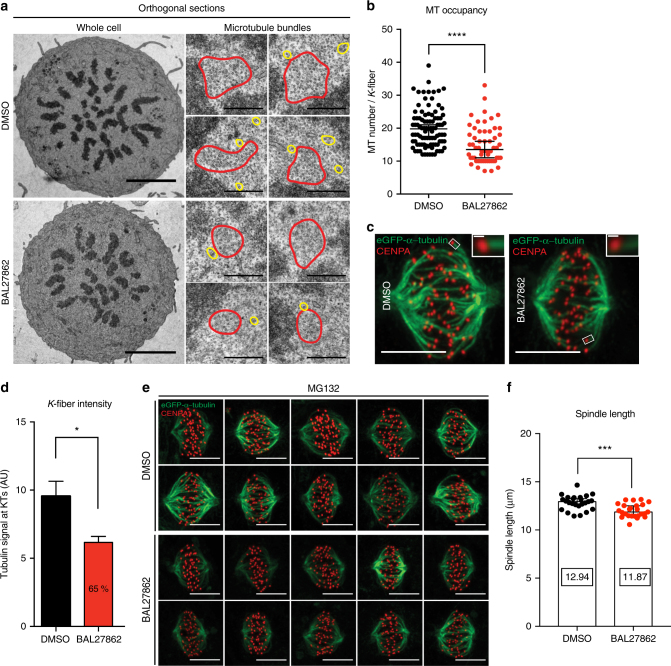
BAL27862 reduces KT–MT occupancy. a Transmission electron microscopy orthogonal sections of hTert-RPE1 GFP-CENPA cells treated with DMSO or 12 nM BAL27862 and blocked in metaphase with 10 μM MG132. Left panels show whole cells at low magnification. Scale bars = 5 μm. Right panel shows individual KT fibres (red circles) or inter-polar MTs (yellow circles). KT fibres were defined as a set of at least 7 parallel MTs, in the vicinity of chromatin and not more than 80 nm separated from one another38. Scale bars = 500 nm. b Quantification of the number of MTs in KT–MT fibres in hTert-RPE1 GFP-CENPA cells treated with DMSO or 12 nM BAL27862. Data are represented as a dot plot; error bars represent 95% CI of medians; each dot represents a single KT fibre (N = 3 independent experiments; n = 59–129 KT fibres, p < 10−4, two-tailed Mann–Whitney U-test). c Immunofluorescence images of hTert-RPE1 eGFP-α-tubulin (green) cells treated either with DMSO or 12 nM of BAL27862 (4 h) and 10 μM of MG132 (2 h) and stained with anti-CENPA antibody (red). Scale bars = 5 μm. Insets show a KT-proximity area measurement. Scale bars = 250 nm. d Quantification of eGFP-α-tubulin intensities at KTs in DMSO and BAL27862-treated cells. N = 3, n = 1135–1156 k-fibres from 29 to 30 metaphase-arrested cells per condition, error bars represent s.e.m., p = 0.045, two-tailed t-test. e Immunofluorescence images of 10 randomly selected hTert-RPE1 eGFP-α-tubulin cells from a single experiment. Cells were treated in parallel with DMSO or 12 nM BAL27862, 10 μM of MG132, and stained with anti-CENPA antibodies (red). Scale bars = 5 μm. f Quantification of spindle length in hTert-RPE1 Centrin1-GFP/GFP-CENPA cells treated with DMSO or 12 nM BAL27862. N = 4, n = 25 cells; error bars represent 95% CI of medians, p = 0.0002, two-tailed t-test. *, **, ***, **** represent p <0.05, <0.01, <0.001, <0.0001 respectively

