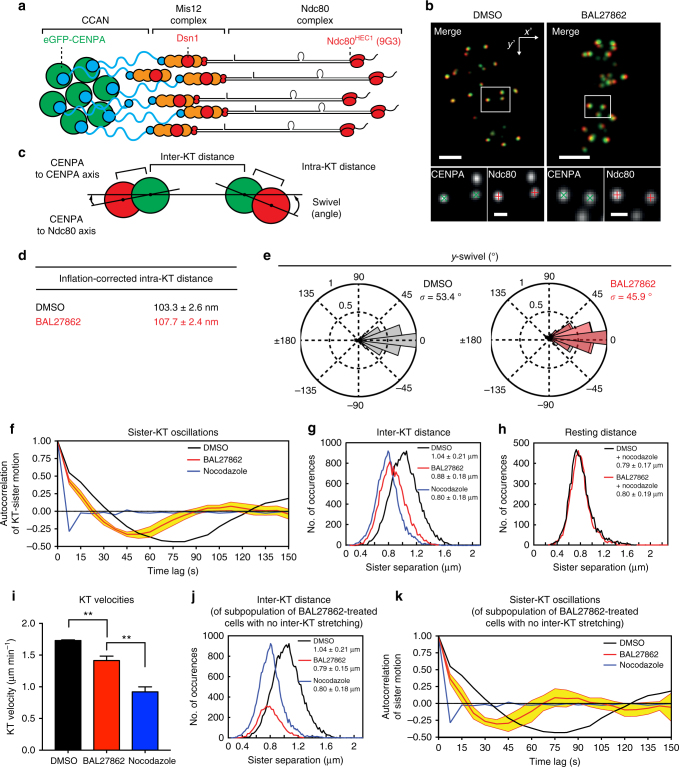
Fig. 2.
MT occupancy controls inter-KT stretching. a Schematic of human KTs showing relative positions of GFP-CENPA (green) and Ndc80 (9G3, red). b Immunofluorescence images of hTert-RPE1 GFP-CENPA cells (green) treated with DMSO or 15 nM BAL27862 stained for Ndc80 (red). Insets illustrate sub-pixel localization of GFP (green crosses) and Ndc80 (red crosses). Scale bars = 2 μm for merged images, 500 nm for insets. c Schematic of inter- and intra-KT distances and swivel measurements. d Quantification of inflation-corrected 3D intra-KT distances for cells treated with DMSO or 15 nM BAL27862. N = 4, n = 2251–2507 KTs, p = 0.013 in two-tailed z-test. Values given are means ± s.e.m. e Swivel ranges for KTs in cells treated with DMSO (black), or 15 nM BAL27862 (red). Values given are s.d., N = 4; n = 1952–2263 sister-KT pairs. f Autocorrelation curves of sister-KT pairs of cells treated with DMSO (black), 12 nM BAL27862 (red), or 1 μg ml−1 nocodazole (blue); yellow is 95% CI for BAL27862-treated cells; n = 770-880 sister-KT pairs; N = 2–4. g Distribution of inter-KT distances (CENPA-CENPA) in cells treated with DMSO (black), 12 nM BAL27862 (red) or 1 μg ml−1 nocodazole (blue), N = 2–4; n = 770–880 sister-KT pairs; values are means and s.d.; all conditions are different from one another (p < 10−4, two-tailed Mann–Whitney U-test). h Resting inter-KT distances measured in cells co-treated with 1 μg ml−1 nocodazole and either DMSO (black, n = 289) or 12 nM BAL27862 (red, n = 310; values are means and s.d.). i Sister-KT velocities of cells treated with DMSO, 12 nM of BAL27862, or 1 μg ml−1 nocodazole. N = 2–4; n = 549–579 sister-KT pairs; values are means and s.e.m., p = 0.007 DMSO vs. BAL27862, p = 0.002 BAL27862 vs. nocodazole in two-tailed ANOVA test; ** represents p < 0.01. j Distribution of inter-KT distances in the subpopulation of BAL27862-treated cells with average inter-KT distance <0.8 μm (red; n = 182 sister-KTs; N = 2–4; values are means and s.d.). k Autocorrelation curves and 95% CI (yellow) of sister-KT pairs shown in j

