Fig. 6.
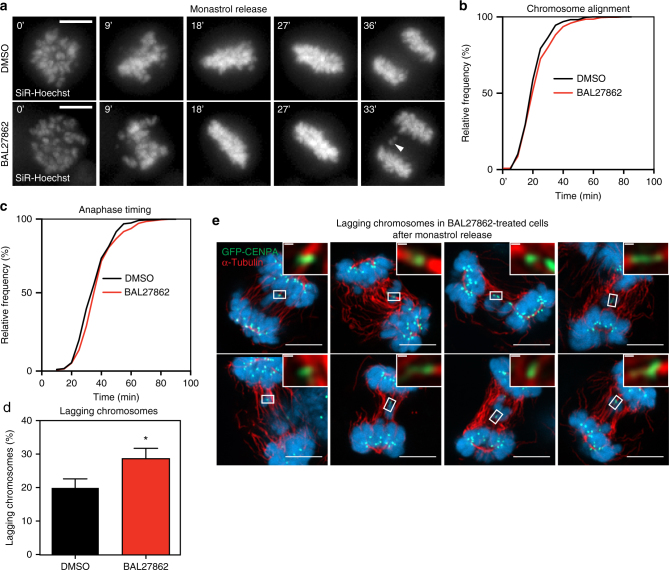
Complete KT–MT occupancy prevents lagging chromosomes. a Time lapse images of hTert-RPE1 GFP-CENPA cells released from a monastrol-treatment (T = 0 min). SiR-Hoechst was used to visualize chromosomes; a lagging chromosome is marked with white arrowhead. Scale bar = 5 μm. b, c Cumulative frequency graph of chromosome alignment (b) and anaphase time (c) in hTert-RPE1 GFP-CENPA cells treated with DMSO (black) or 12 nM BAL27862 (red) in a monastrol-release assay. T = 0 at monastrol release. N = 9, n = 530–549 cells. d Percentage of cells treated with DMSO or 12 nM BAL27862 with lagging chromosomes in anaphase after a monastrol release, * DMSO vs BAL27862 p = 0.0135 in ratio paired two-tailed t-test, N = 9, n = 459–469 cells, error bars show s.e.m. e Immunofluorescence images of 10 hTert-RPE1 GFP-CENPA cells from a single monastrol release experiment. Cells were treated in parallel with DMSO or 12 nM BAL27862 and 100 μM monastrol (4 h), released from monastrol for 60 min, fixed and stained with α-tubulin antibodies (red). Scale bars = 5 μm. Inserts show single, merotelically attached KTs. Scale bars = 250 nm

