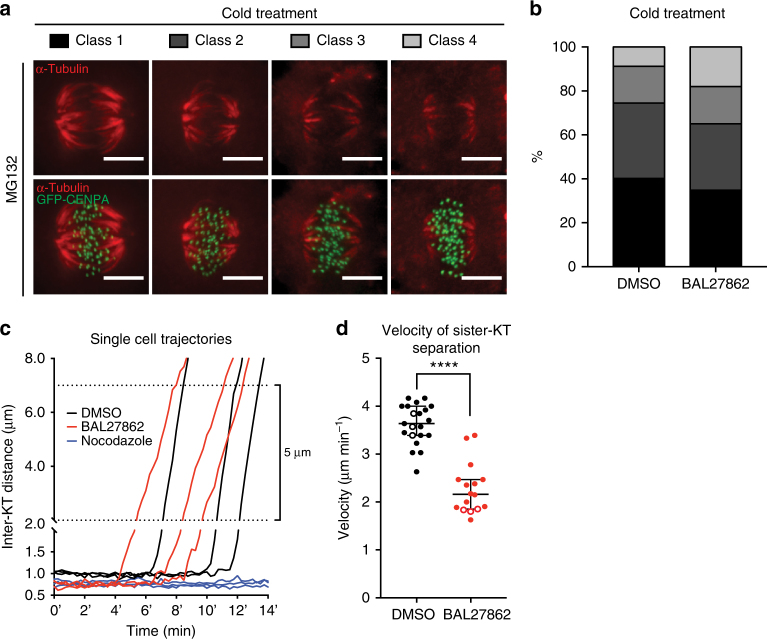
Fig. 7.
Complete KT–MT occupancy ensures robust anaphase forces. a, b Cold stable assay in hTert-RPE1 GFP-CENPA cells treated with DMSO or 12 nM BAL27862 and stained for α-tubulin. b Quantification of the cold stable assay. N = 3, n = 89–102 cells. c Exemplary curves of average sister-KT distances in anaphase in hTert-RPE1 GFP-CENPA cells treated with DMSO (black), 12 nM BAL27862 (red) or 1 μg ml−1 nocodazole (negative control; blue). T = 0 indicates the start of the movies. d Dot plot of anaphase speeds in hTert-RPE1 GFP-CENPA cells treated with DMSO or 12 nM BAL27862; empty dots are cells represented in c; N = 3, n = 16–21, error bars show 95% CI of medians, **** represents p < 0.0001 in two-tailed t-test

