Fig. 8.
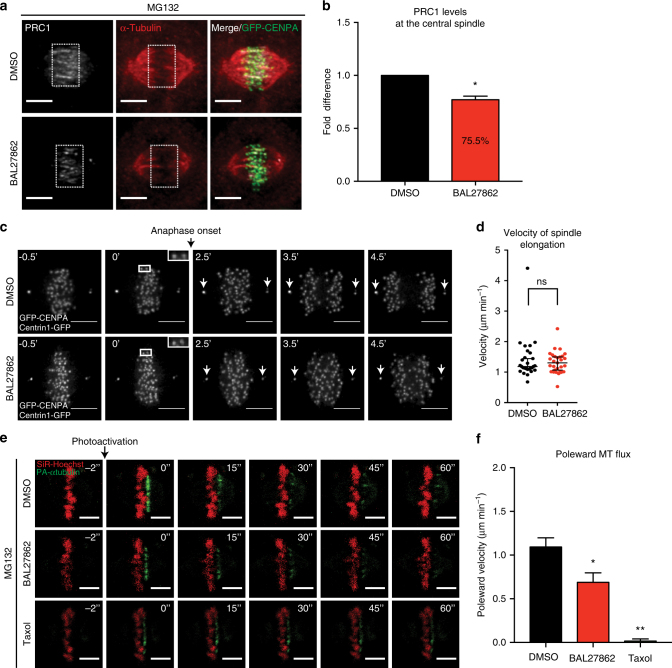
Low doses of BAL27862 specifically affect anaphase A. a Immunofluorescence images of hTert-RPE1 GFP-CENPA cells treated in parallel with DMSO or 12 nM BAL27862, and 10 μM MG132 after staining for α-tubulin (red) and PRC1 (grey). Scale bars = 5 μm. b Quantification of PRC1 intensities in hTert-RPE1 GFP-CENPA cells normalized to DMSO; N = 3, n = 104–105 cells, error bars are s.e.m, * represents p = 0.026, ratio paired two-tailed t-test. c Time lapse images of hTert-RPE1 Centrin1-GFP/GFP-CENPA cells treated with DMSO or 12 nM of BAL27862 (4 h). Scale bars = 5 μm. White arrows at spindle poles indicate position of centrosomes (Centrin1-GFP). d Quantification of spindle elongation velocities of hTert-RPE1 Centrin1-GFP/GFP-CENPA cells treated with DMSO or 12 nM BAL27862; N = 4, n = 28–29 cells, error bars are 95% CI of medians, p = 0.968, two-tailed Mann–Whitney test. e Time lapse images of hTert-RPE1 PA-GFP-α-tubulin cells treated in parallel with 25 nM SiR-Hoechst (red); DMSO, 12 nM BAL27862, or 10 μM taxol; and 10 μM MG132. The green signal indicates the position of the PA-GFP-α-tubulin over time. Scale bars = 5 μm. f Quantification of poleward MT flux rates of hTert-RPE1 PA-GFP-α-tubulin cells; N = 3, n = 30–49 k-fibres from 17 to 30 cells, error bars are s.e.m., * represents p = 0.041 DMSO vs. BAL27862; ** represent p = 0.004 for BAL27862 vs. taxol, in two-tailed ANOVA test

