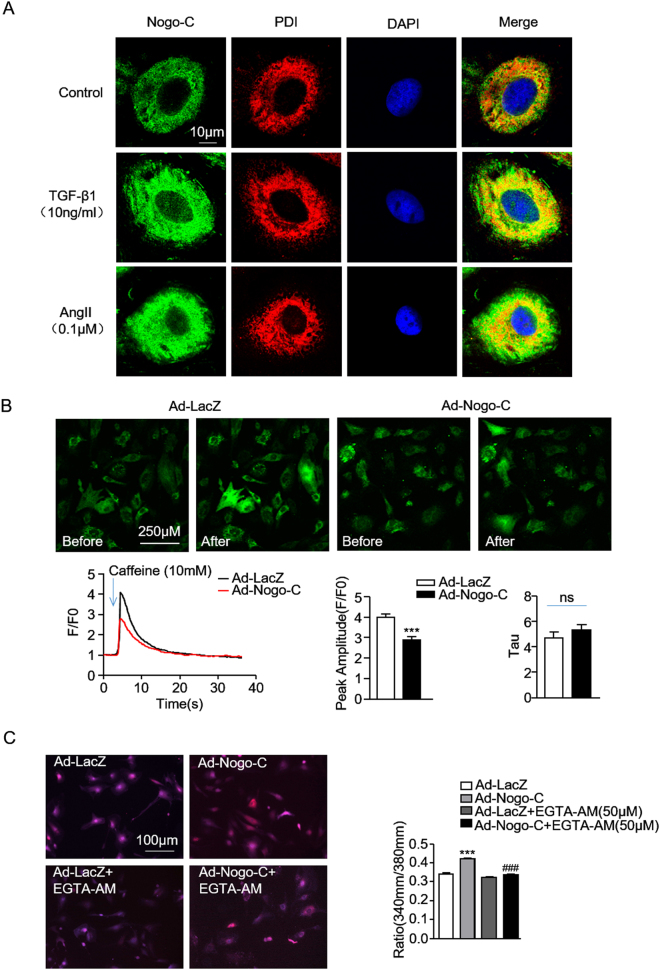
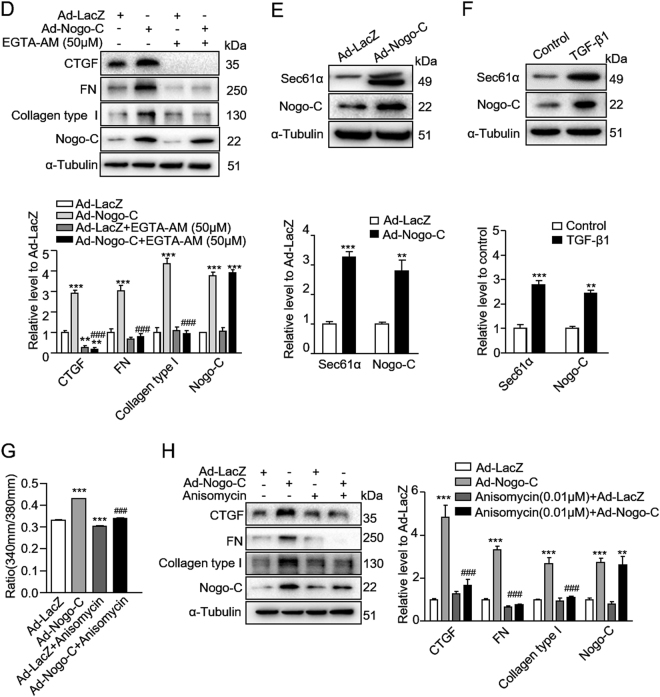
Fig. 5. Nogo-C regulates fibrotic responses throughincreasing intracellular Ca2+ concentration.
a Immunofluorescence staining showing the co-localization of Nogo-C with ER in cardiac fibroblasts with/without TGF-β1 or AngII stimulation. Scale bar = 10 μm. b Representative images (upper) and average data (bottom) showing the ER Ca2+ release in response to caffeine (10 mM) stimulation in cardiac fibroblasts transfected with Ad-Nogo-C or Ad-LacZ, indicated by Fluo-4 AM fluorescent signal. n = 12 cells from 3 independent experiments for each group. c Representative images (left) and average data (right) showing cytosolic Ca2+ concentration of cardiac fibroblasts transfected with Ad-Nogo-C or Ad-LacZ with/without EGTA-AM (50 μM) treatment. n = 30 cells from 3 independent experiments for each group. d Profibrogenic proteins (CTGF, FN and collagen type I) in cardiac fibroblasts transfected with Ad-Nogo-C or Ad-LacZ with/without EGTA-AM (50 μM) treatment. n = 3 independent experiments. e Sec61α protein level in cardiac fibroblasts transfected with Ad-Nogo-C. f Sec61α protein level in cardiac fibroblasts in the presence of TGF-β1 (10 ng/ml) for 48 h. g Cytosolic Ca2+ concentration in cardiac fibroblasts transfected with Ad-Nogo-C or Ad-LacZ with/without Sec61α inhibitor Anisomycin (0.01 μM). h Profibrogenic proteins in cardiac fibroblasts transfected with Ad-Nogo-C or Ad-LacZ with/without Sec61α inhibitor Anisomycin (0.01 μM). n = 3 independent experiments. *P < 0.05, **P < 0.01, ***P < 0.001 vs Ad-LacZ or control group. #P < 0.05, ##P < 0.01, ###P < 0.001 vs Ad-Nogo-C group


