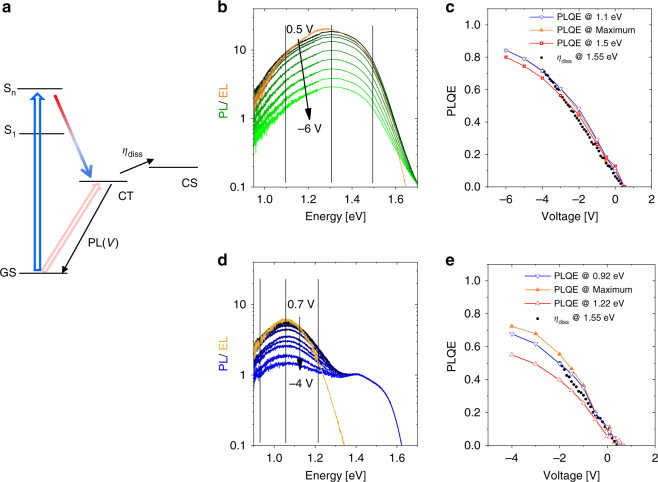
Fig. 5.
Bias-dependent photoluminescence; a energy scheme describing the competition between the recombination of the occupied CT state manifold, yielding PL with an intensity PL(V) and the dissociation of the very same manifold into free carrier with an efficiency . b Bias-dependent PL data (green lines), compared to the EL driven at a bias of 1.2V (orange line), c bias-dependent photoluminescence quenching efficiency PLQE(V), referenced to a voltage V0 = 0.5V for a 150 nm thick PCPDTBT:ICBA blend. PLQE data are plotted for three different detection energies, below, at and above the PL maximum (line-connected symbols). Solid black points display the prediction by Eq. 1 based on our bias-dependent TDCF experiments on the same devices. d, e the same for a 150 nm thick PCPDTBT:PCBM blend with the EL at 0.7 V

