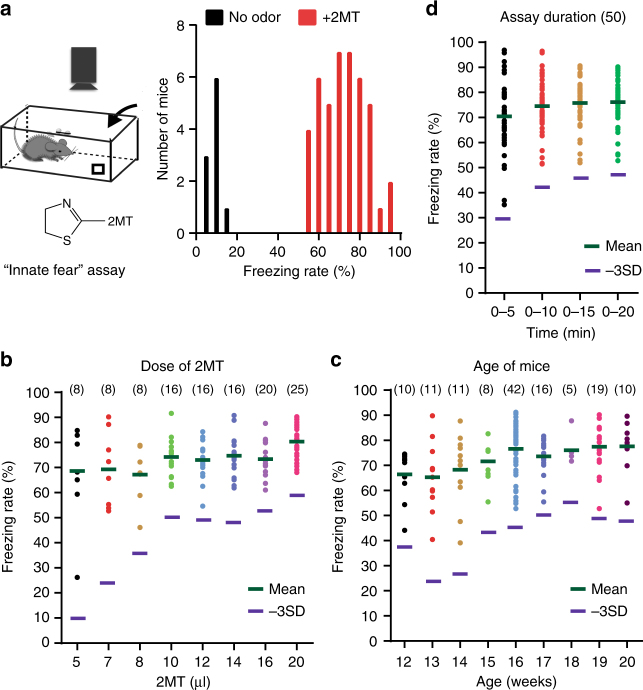
Fig. 1.
Development of a highly robust innate fear assay. a A schematic of 2MT-evoked innate fear assay (left). A quantitative graph showing the distribution of freezing rates of C57BL/6J males with or without (20 µl = 2.1 × 10⁻⁴ mole) 2MT exposure (right). b A graph showing the distribution of freezing rates (average 20 min) in C57BL/6J males (>15 week old) at different doses of 2MT exposure. c A graph showing the distribution of freezing rates (average 20 min) at different ages of C57BL/6J males exposed to 20 µl of 2MT. d A graph showing the distribution of freezing rates for different assay duration using C57BL/6J males. −3SD, 3 standard deviation (SD) below the normal mean of freezing rates upon 2MT exposure. The numbers in parentheses indicate the sample numbers for individual conditions

