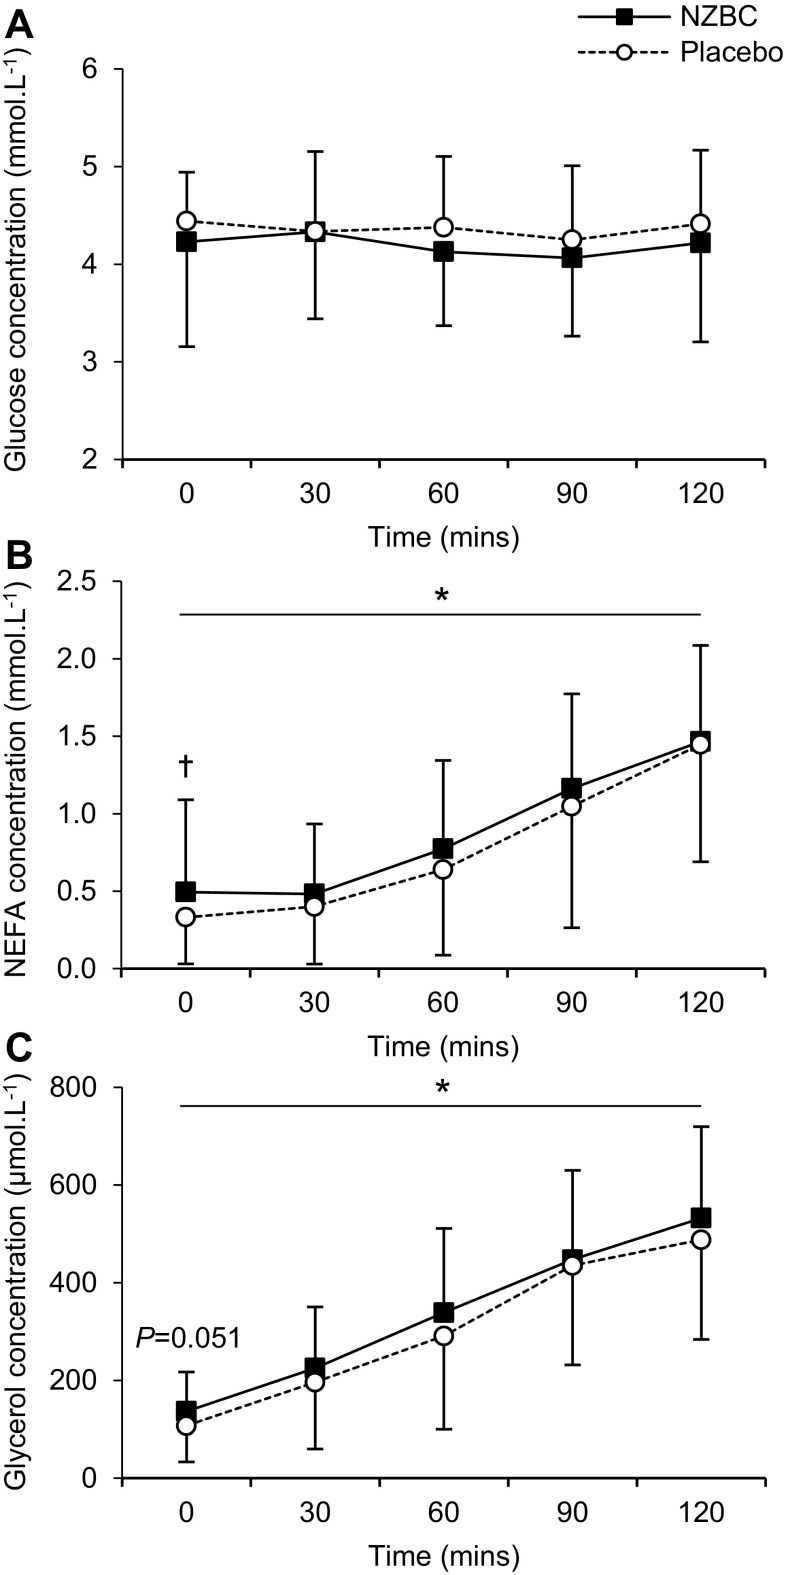
Fig. 2.
Plasma glucose (a), NEFA (b), and glycerol (c) concentrations during 2 h cycling at ~ 65% VO2max following 7 days supplementation with NZBC extract or placebo. Values are presented as mean ± S.D. *Main time effect (P < 0.001). †Significantly different from placebo at the equivalent time point (P = 0.034)

