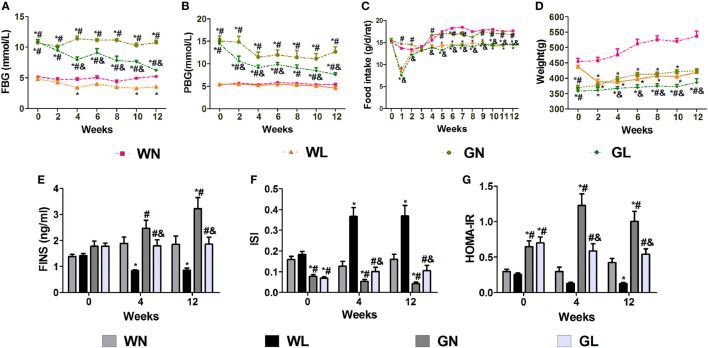
Figure 1.
Liraglutide attenuated glucose levels, body weight gain, and insulin resistance. (A) Fasting blood glucose (FBG) levels. (B) Postprandial blood glucose (PBG) levels. (C) Food intake. (D) Body weight. (E) Fasting insulin (FINS) levels. (F) Insulin sensitivity index (ISI). (G) The homeostatic model assessment-insulin resistance (HOMA-IR). Data are presented as the mean ± SEM. *P < 0.05 vs WN group; #P < 0.05 vs WL group; and &P < 0.05 vs GN group.

