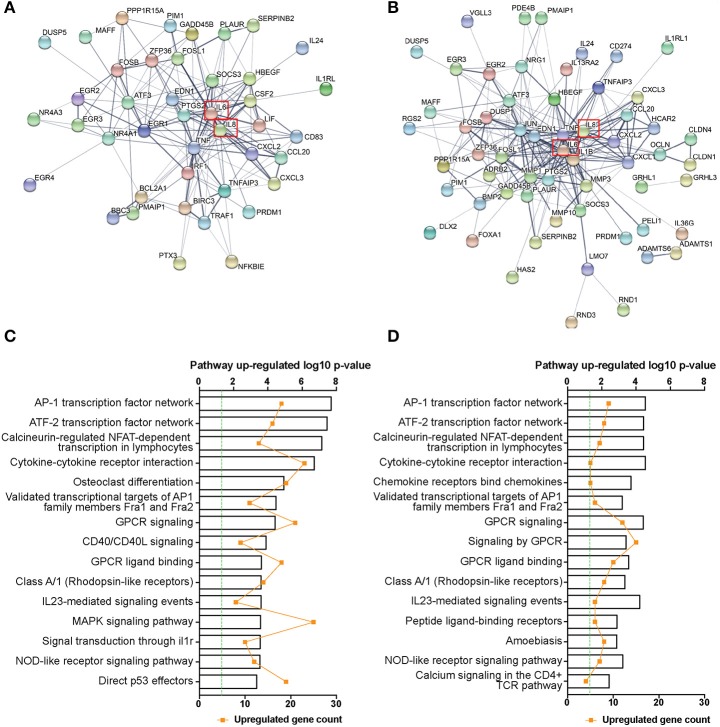
Figure 1.
RNAseq transcriptome network and pathway enrichment of 5448- and JRS4 GAS-infected TEpi cells in comparison to mock cells. Protein-protein interaction network of the top 100 differentially expressed genes (at an adjusted P < 0.05) for (A) 5448-infected TEpi cells in comparison to mock TEpi cells and (B) JRS4-infected TEpi cells in comparison to mock TEpi cells, generated using STRINGdb (http://string-db.org/). IL-8 is highlighted (red box). Network edges show the confidence of interactions, where the line thickness indicates the strength of data support. Active interaction sources include textmining, experiments, databases, co-expression, neighborhood, gene fusion and co-occurrence. Minimum required interaction score of medium confidence (0.400). Non-protein coding genes and disconnected nodes are not shown. Node color is arbitrary. (C) Pathway over-representation analysis of all differentially expressed genes (adjusted P < 0.05, Log2FC >1 or <-1) for 5448 infected TEpi cells in comparison to mock cells and (D) JRS4-infected TEpi cells in comparison to mock cells was performed using Innatedb.com. Fold-change cutoff (±) 1.0 and P-value cutoff 0.05. Hypergeometric analysis algorithm was used, with Benjamini–Hochberg correction method. Top 15 up-regulated pathways shown. Green line indicates threshold for significance. Metadata from analysis results shown in Tables S1, S2.

