FIGURE 2.

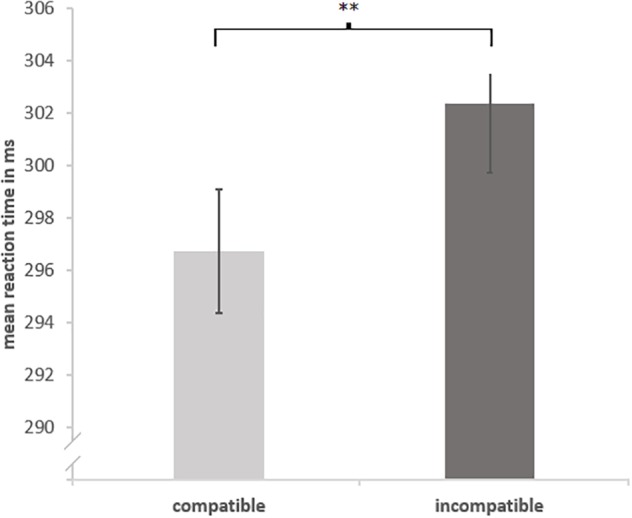
Main effect compatibility. Mean reaction times split by compatibility. Error bars show standard error corrected for within-subject designs (Morrey, 2008). “∗∗” shows p < 0.01.

Main effect compatibility. Mean reaction times split by compatibility. Error bars show standard error corrected for within-subject designs (Morrey, 2008). “∗∗” shows p < 0.01.