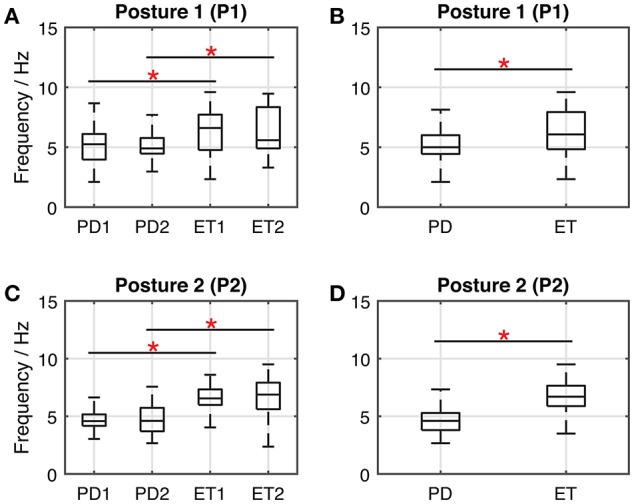
Figure 4.

Boxplots representing the dominant frequencies (from the bispectrum analysis) of the tremor acceleration signals. Horizontal lines of the box indicates maximum, upper quartile, median value, lower quartile and minimum of the group. Panels (A,B) illustrate the condition with the arm-stretching posture (P1); Panels (C,D) illustrate the condition with the arm-rested posture (P2). In panels (A,C), the group pairs considered for statistical analysis include: PD1-PD2, ET1-ET2, PD1-ET1, and PD2-ET2. Significance level (*): P < 0.05. Group PD = PD1 + PD2; Group ET = ET1 + ET2.
