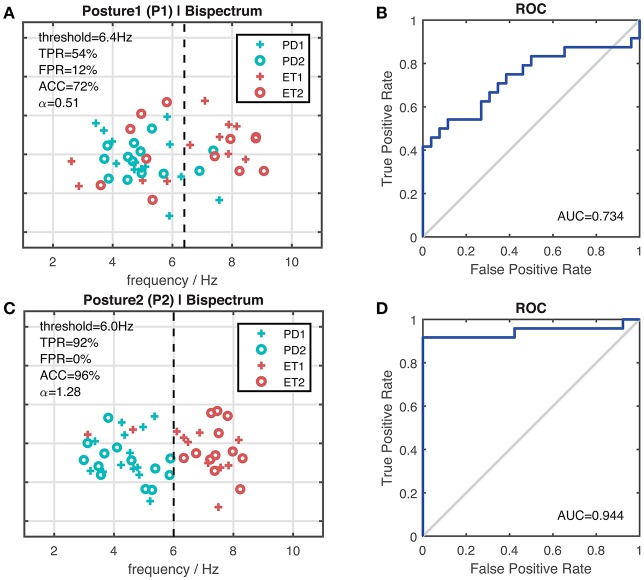
Figure 8.
Results of dominant frequency with the maximum recording length of 300 s per segment in differentiating between the PD cohort and the ET cohort. (A) Scatter plot representing dominant frequencies under the bispectrum estimate with the arm-stretching posture (P1). (B) ROC curve corresponding to the case of (A). AUC is 0.734 (95%CI 0.587–0.881) with a standard error of 0.075. (C) Scatter plot representing dominant frequencies under the bispectrum estimate with the arm-rested posture (P2). (D) ROC curve corresponding to the case of (C). AUC is 0.944 (95%CI 0.863–1.000) with a standard error of 0.041.

