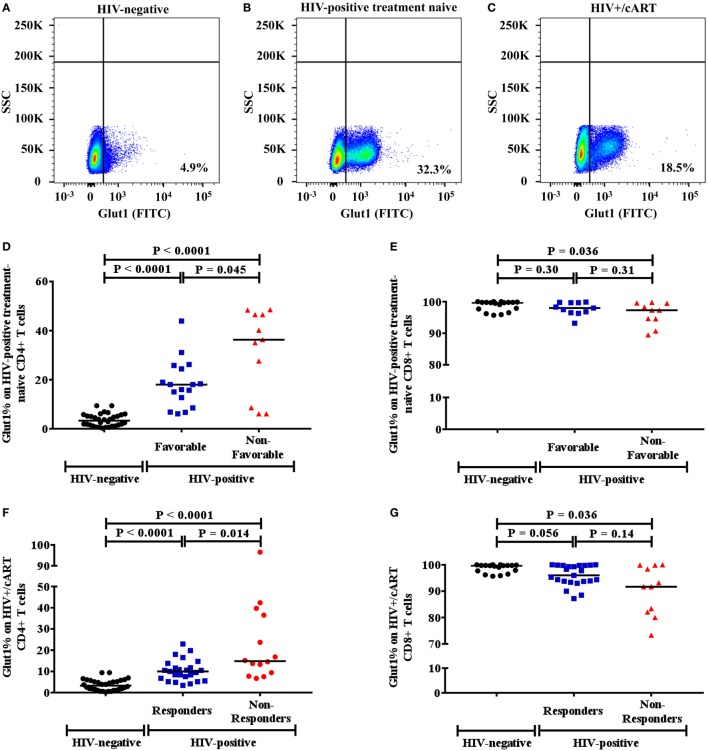
Figure 1.
Gaiting strategy and analysis of CD4+Glut1+ T cell percentage in HIV-negative and HIV-positive populations. (A–C) Percentage of Glut1 expressing CD3+CD4+ T cells within the lymphocyte population were defined using side scatter (SSC) and the Glut1 fluorophore (FITC); (D,E) comparison between HIV-negative controls and HIV-positive treatment-naïve groups with favorable and non-favorable disease progression; (F,G) comparison between HIV-negative controls and HIV+/cART responder and non-responder groups. Horizontal black lines refer to median CD4+Glut1+ or CD8+Glut1+ T cell percentages of each group. cART, combination antiretroviral therapy.

