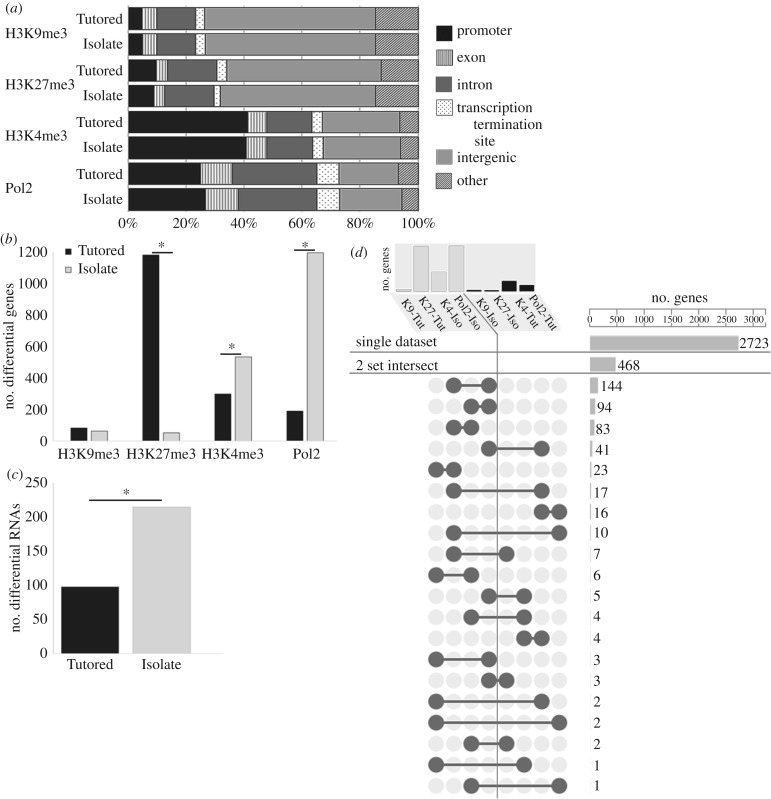
Figure 2.
ChIPseq and RNAseq demonstrate more transcriptional regulation in the Isolate condition. (a) ChIPseq read alignment demonstrates expected genomic distribution of PTM and Pol2 peaks, with similar distributions in Tutored and Isolate samples. (b) The number of Isolate and Tutored genes differentially associated with H3K9me3 (Tutored: 83, Isolate: 62), H3K27me3 (Tutored: 1181, Isolate: 51), H3K4me3 (Tutored: 298, Isolate: 533), and Pol2 (Tutored: 189, Isolate: 1196). (c) RNAseq showed a greater number of relatively more abundant RNAs in Isolate compared to Tutored auditory forebrain. (b,c) Asterisk designates significantly different proportions at p < 0.05. (d) ChIPseq datasets are ordered to display the number of genes (top) in Isolate-on (light grey) and Tutored-on (black) genesets. Lower panel illustrates specificity; 2723 of 3228 genes are unique to one dataset, 468 more genes were represented in two datasets. Barbell graphics show which two datasets share genes, with the number of genes on the right. Adapted from UpSet [39].

