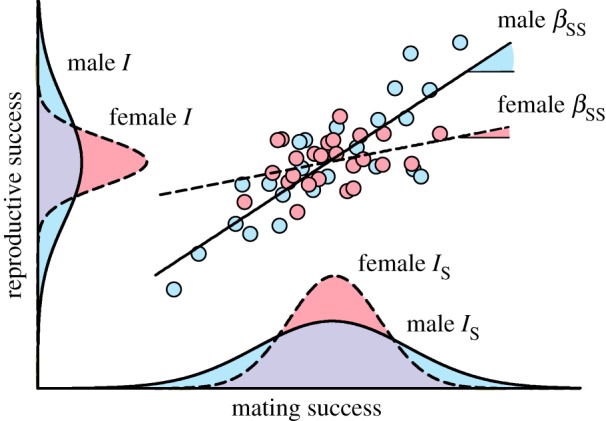
Figure 1.

Bateman's three metrics. The variance in reproductive success (e.g. number of offspring produced) and the variance in mating success (e.g. number of mating partners) capture the opportunity for selection (I) and for sexual selection (Is), respectively. High variances indicate high opportunity for (sexual) selection. The regression slope is the Bateman gradient, which thus corresponds to the fitness benefits gained per additional mating. Steep Bateman gradients indicate intense sexual selection. The data points depicted here are fictional and only for illustrative purpose. (Online version in colour.)
