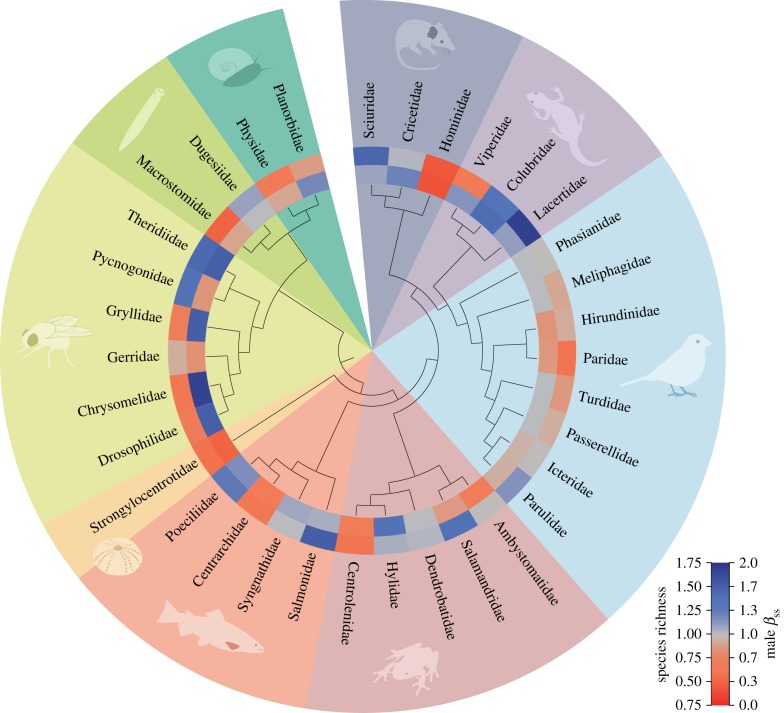
Figure 2.
Male Bateman gradient predicts species richness across 34 animal families. Phylogenetic tree of the studied families with their levels of species richness (inner ring) and the strength of sexual selection in males as estimated by the Bateman gradient (outer ring). Colour cells represent family averages. (Online version in colour.)

