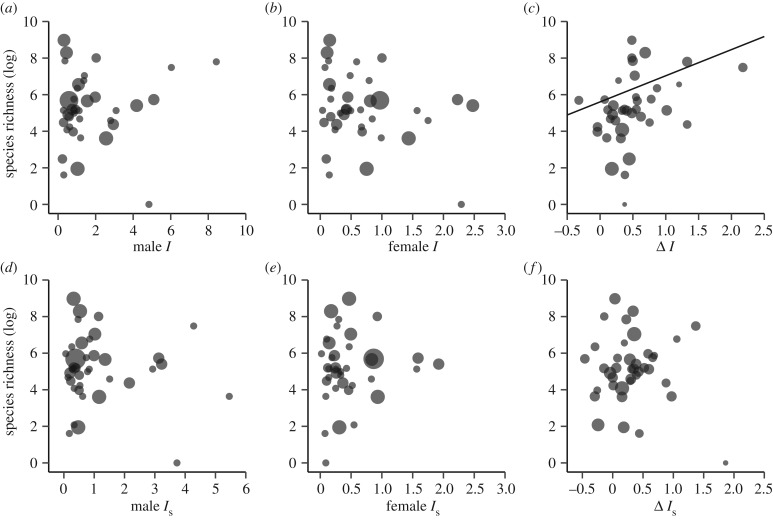
Figure 4.
Bubble plots and PGLS regressions showing the effect of family species richness (log-transformed) on male, female and sex difference (male−female) of (a–c) the opportunity for selection (Is) and (d–f) the opportunity for sexual election (Is). Regression slopes that differ significantly from zero are shown.

