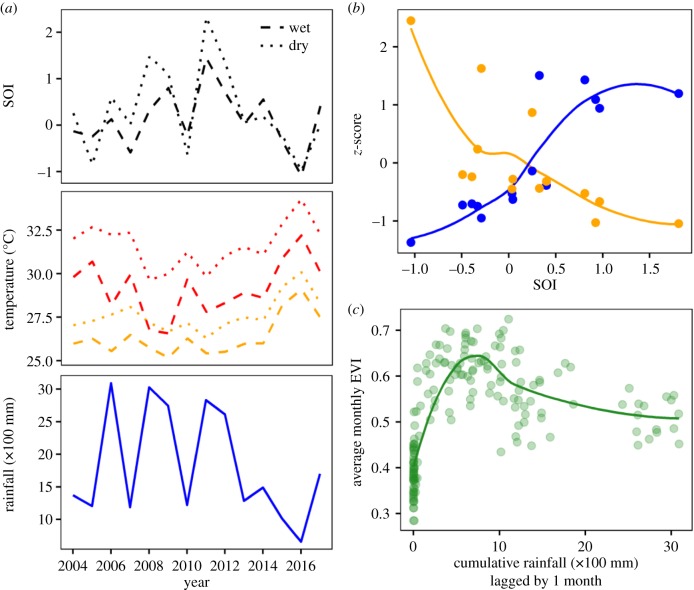
Figure 2.
SOI, local temperature and rainfall, and Enhanced Vegetation Index (EVI) measurements for Santa Rosa National Park, Costa Rica between 2003 and 2017. (a) Time-series of seasonally averaged monthly SOI (black), seasonally averaged daily maximum (red) and mean (orange) temperatures and total annual rainfall (blue). Monthly SOI and daily maximum and mean temperatures were averaged for the dry (April, December–March) and wet (May–November) seasons. Rainfall was summed from April to the following March. (b) z-scores of average annual mean daily temperature (orange) and total annual precipitation (blue) in relation to annual average SOI. (c) Average monthly EVI in relation to cumulative rainfall from the previous month in the Santa Rosa study area. EVI plateaued between 500 and 1000 mm of cumulative rainfall, which was achieved in all but one of the study years. Curves in (b) and (c) were estimated from a local polynomial regression.

