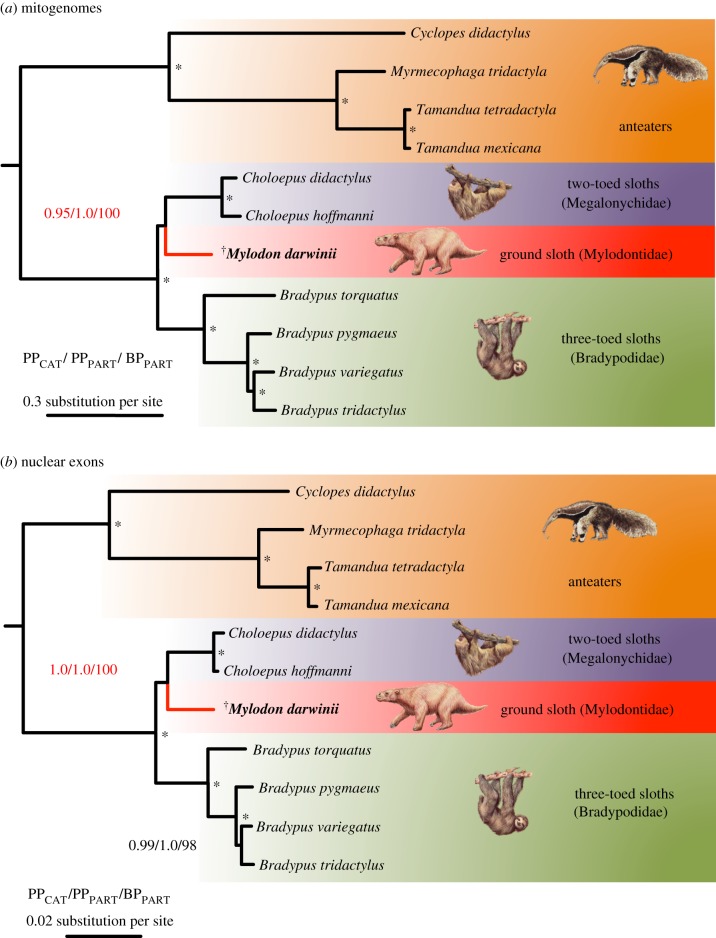
Figure 2.
Bayesian consensus phylograms of Pilosa obtained under the site-heterogeneous CAT-GTR+G4 mixture model for the (a) mitogenomic and (b) nuclear datasets. Values at nodes represent clade posterior probabilities under the CAT model (PPCAT), mixed model (PPPART), and maximum-likelihood bootstrap percentages under a partitioned model (BPML). Asterisks indicate maximum support from all statistical indices. The complete phylograms are available in electronic supplementary material, figures S3–S8. Graphical representation and taxon images derive from Gibb et al. [21].

