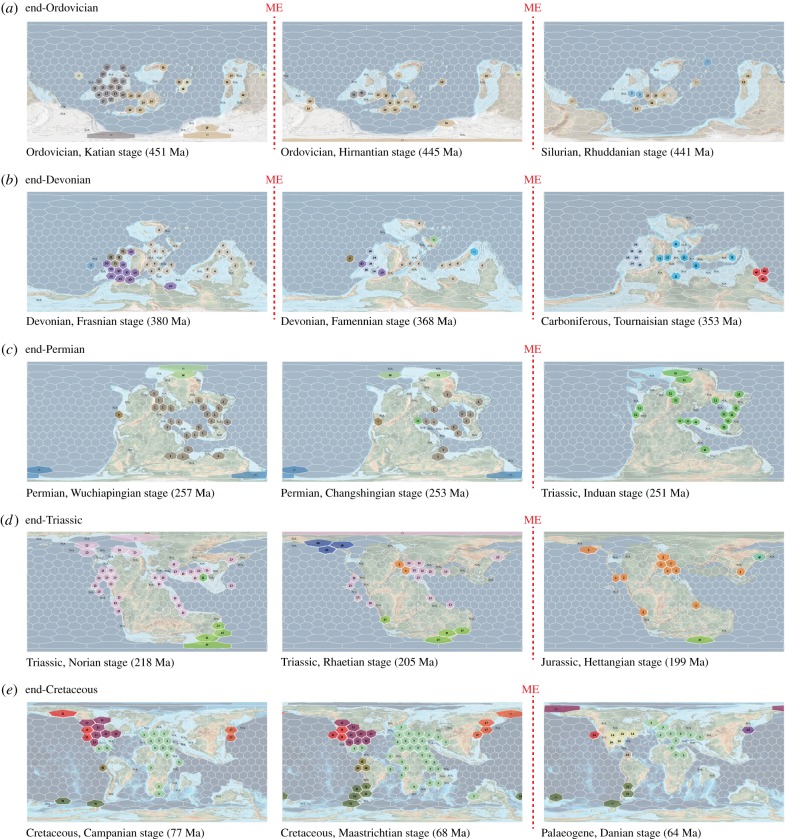
Figure 1.
Geographical positions of bioregions before and after the traditional ‘Big Five’ mass extinctions [1]. Dashed vertical lines indicate mass extinction boundaries. The end-Ordovician and end-Devonian extinctions comprise three stages. Numbers and colours indicate time-traceable bioregions. N/A entries denote cells with inadequate sampling (less than 10 occurrences). Maps are the PALEOMAP raster series of C. Scotese [19].

