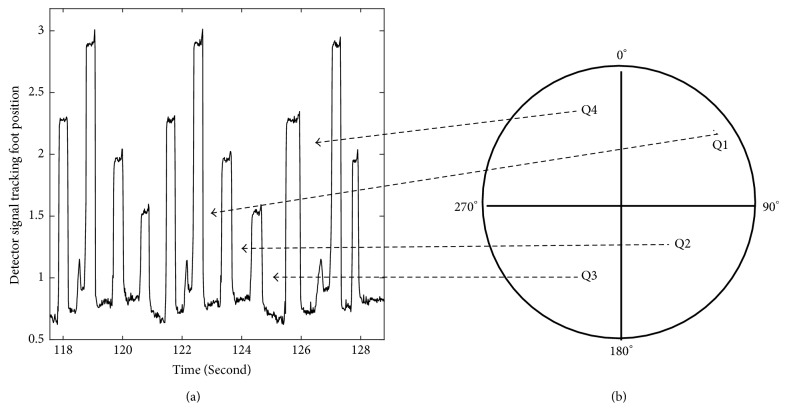
Figure 1.
The position of the foot during cycling was tracked with a system of detectors fixed to the wheel of the ergometer. (a) The left panel shows the signal emitted by the detector for two and half revolutions. Each peak in the signal indicates a specific position of the foot during the cycling: for example, the maximum signal amplitude (highest peak in the signal) was emitted when the foot reached at the 0° position. (b) The periods of time between the peaks correspond to the times spent in each of the four quadrants, as indicated.

