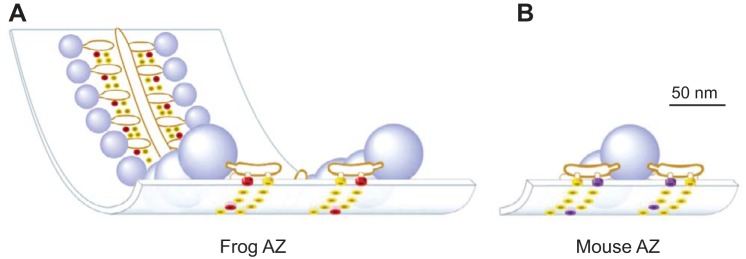
Fig. 1.
Schematic diagrams of single active zone (AZ) organization within the frog (A) and mouse (B) neuromuscular junction (NMJ) based on electron microscopy data. Blue spheres = docked synaptic vesicles. Yellow disks = AZ membrane proteins of unknown identity. Red disks = Cav 2.2 type VGCCs. Purple disks = Cav 2.1 type VGCCs. [Adapted from Urbano et al. 2003 with permission from National Academy of Sciences. Copyright (2003) National Academy of Sciences, U.S.A.]

