Fig. 2.
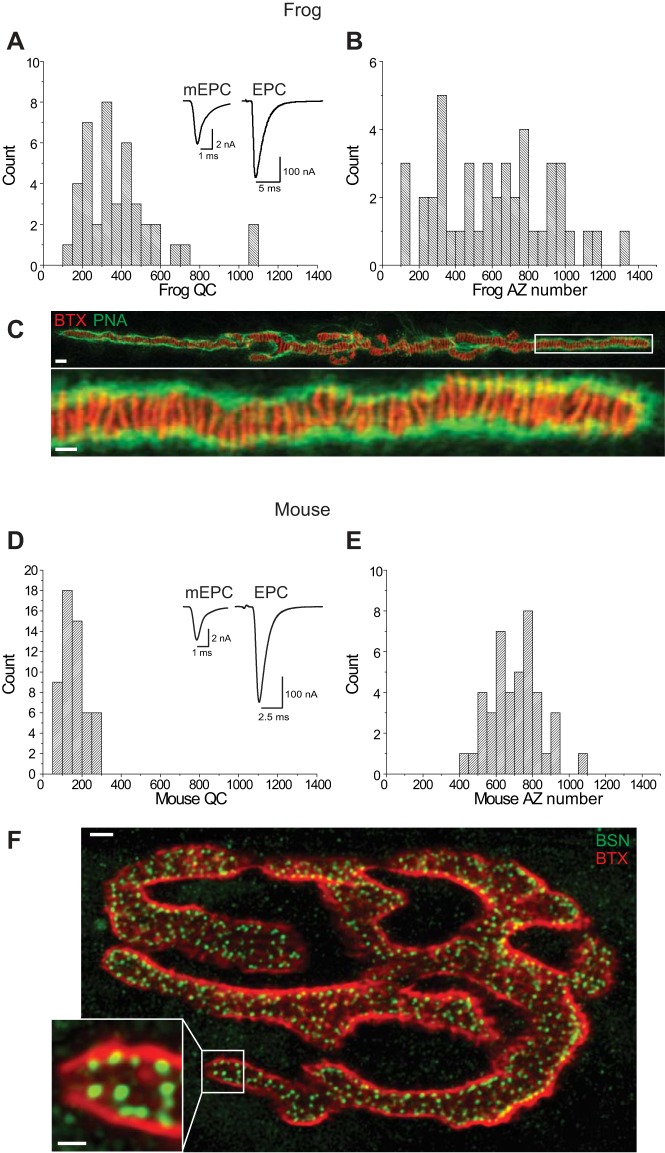
Quantal content and AZ number at frog and mouse NMJs. A: histogram plot of the distribution of quantal content (QC) measurements determined using 2-electrode voltage clamp at frog NMJs. Inset shows sample mEPP (left; average of 300 events) and EPP (right; average of 15 events) recordings. B: histogram plot of the distribution of AZ numbers measured across frog NMJs. C: representative image of a frog NMJ stained with Alexa-488 peanut lectin (PNA, green) to outline synapses, and Alexa-594 α-bungarotoxin (BTX, red) to stain postsynaptic acetylcholine receptors and predict the location of AZs (red stripes). White box in the top image identifies the region that is enlarged in the bottom image. Scale bars = 5 µm (top) and 2 µm (bottom). D: histogram plot of the distribution of quantal content measurements determined using 2-electrode voltage clamp at mouse NMJs. Inset shows sample mEPP (left; average of 300 events) and EPP (right; average of 15 events) recordings. E: histogram plot of the distribution of AZ numbers measured across mouse NMJs. F: representative image of a mouse NMJ stained with Alexa-488 conjugated secondary antibody that recognized an anti-bassoon primary antibody to identify the location of AZs (BSN, green), and Alexa-594 α-bungarotoxin (BTX, red) to stain postsynaptic acetylcholine receptors and identify the extent of each NMJ. White box in the larger image identifies the region that is enlarged in the inset image. Scale bars = 5 µm (large image) and 2 µm (inset).

