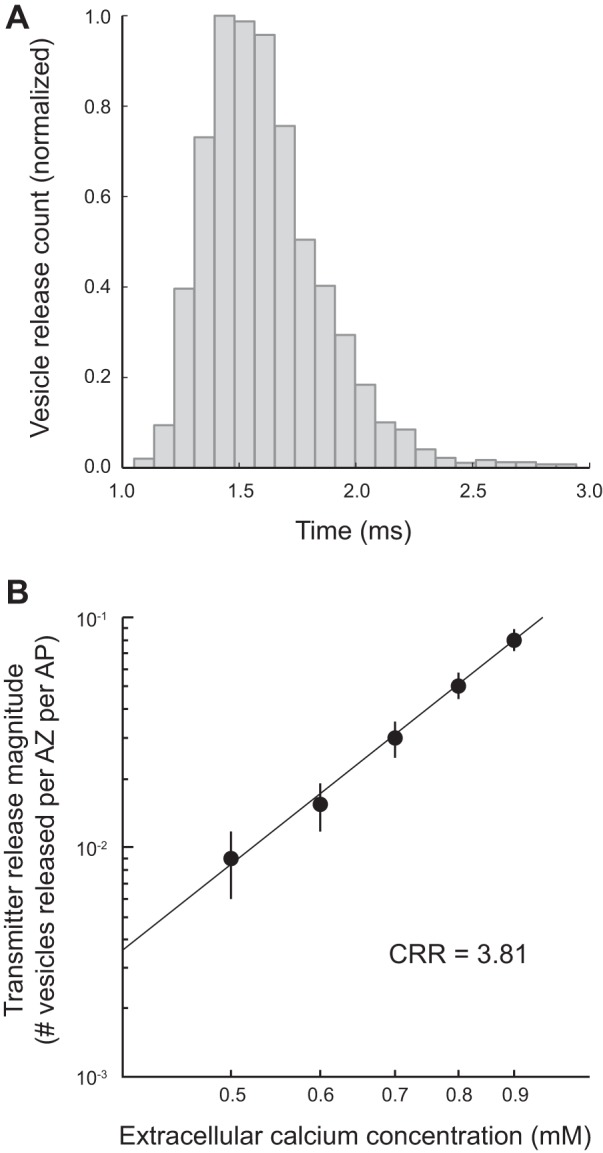
Fig. 5.

Distribution of transmitter release latencies and the Ca2+-release relationship (CRR) predicted by the mouse MCell model. A: histogram plot of the time course of single vesicle release events in the mouse MCell model following a presynaptic action potential closely matching previously published physiology data (Wang et al. 2010). B: plot of the changes in the magnitude of transmitter release (number of vesicles released per AZ per AP) as the extracellular Ca2+ concentration was varied in the mouse MCell model. When plotted on a log scale, these data are fit by line with a slope of 3.81, closely matching the known 4th-order relationship between extracellular Ca2+ and transmitter release.
