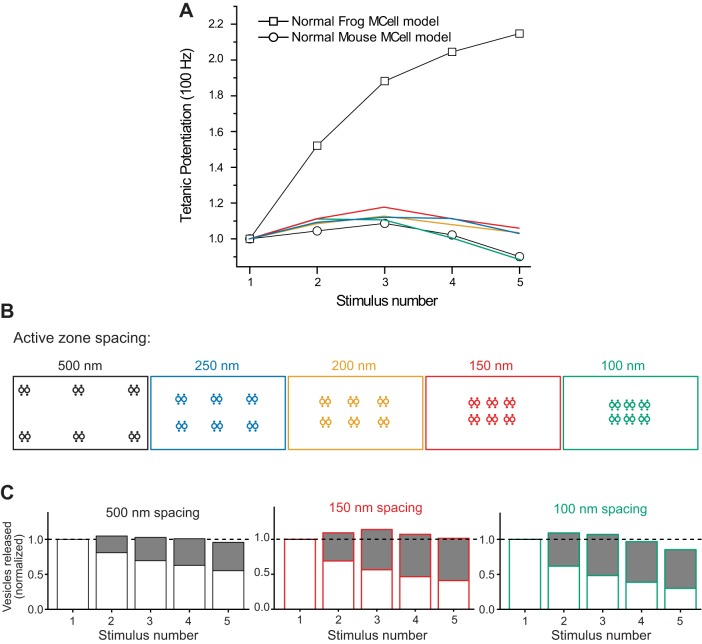
Fig. 9.
The impact on tetanic potentiation of moving modeled mouse AZs closer together. A: plot of tetanic potentiation during a 100-Hz action potential train. Open squares and circles recapitulate the control MCell model data for frog and mouse AZs (see Fig. 6C). Plots in blue, yellow, red, and green represent short-term plasticity for the model in which the 6 modeled AZs are 250, 200, 150, and 100 nm apart from one another as color coded in the diagrams in B. C: plots of the fraction of vesicle fusion events that included residual bound Ca2+ ions (as described in Fig. 7) for 3 AZ spacing arrangements that resulted in the extremes in short-term synaptic plasticity at the modeled mouse AZ (500, 150, and 100 nm AZ spacing, and color coded as in A and B).

