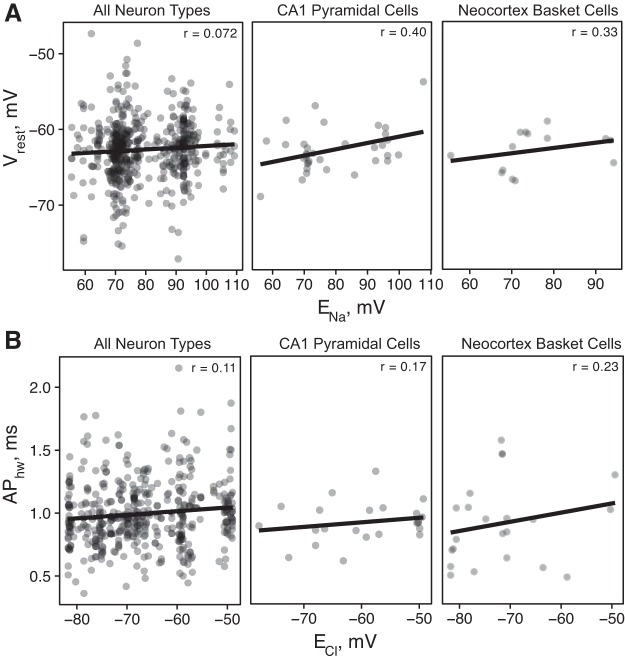
Fig. 5.
Ionic reversal potentials explain some of the observed differences in electrophysiological properties. A and B: each data point represents an experimental condition–electrophysiological property pair curated from an article, and lines show linear fit. x-axis shows the calculated reversal potentials using the Nernst equation (using external and internal concentrations and recording temperatures), and y-axis shows the experimental condition-adjusted electrophysiological data. Because of the difficulties in estimating true reversal potentials at very low concentrations, the x-axis has been filtered to only include data between the 1st and 3rd quartiles.

