Fig. 1.
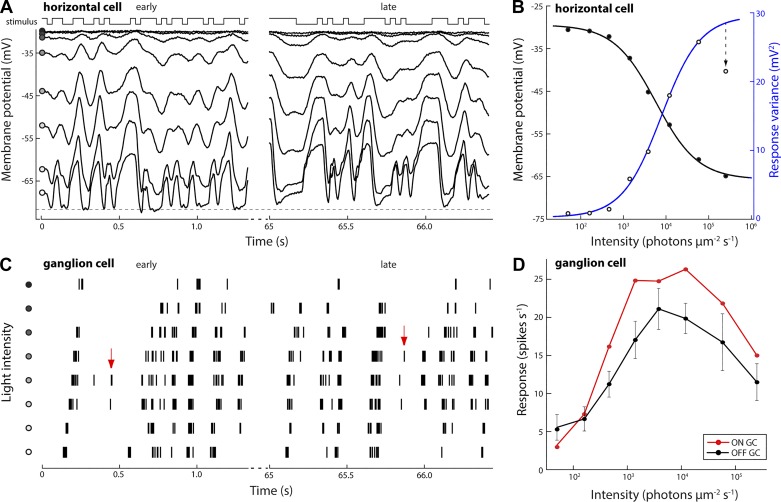
Response amplitudes of horizontal cell and ganglion cell visual responses are reduced at low and at high light levels. A: intracellular response of an A-type horizontal cell stimulated with full-field binary white noise at different mean light levels. Traces show sections of the recorded response immediately following a light level change (t = 0; early) and 65 s later (late). The same white noise sequence was used at each light level. Circles, from dark to light: 4.0 × 101, 1.7 × 10², 4.6 × 10², 1.3 × 10³, 3.6 × 10³, 1.2 × 10⁴, 5.8 × 10⁴, and 2.5 × 10⁵ photons·μm−2·s−1; 70% Michelson contrast. Dashed line indicates an apparent limit to the recorded cell’s hyperpolarization at −73 mV. B: average membrane voltage (filled circles, black) and modulation amplitude (open circles, blue) of horizontal cell responses at each light level. Black and blue traces are sigmoidal fits to the data: y = a + (b − a)/{1 + e[−d(x − c)]}, where a and b are the respective lower and upper asymptotes, c is the half-rise point, and d defines the steepness. Modulation amplitude of the recorded response was reduced at the highest light level (arrow). C: extracellular spike response of an OFF-type ganglion cell stimulated with spatiotemporal binary white noise. Vertical lines represent spikes; rows represent the response recorded at each light level (same levels as in A). Arrows indicate stimulus features were signaled at intermediate light levels but not at low or high light levels. D: average ganglion cell response rates during white noise stimulation at each light level (n = 7 cells).

