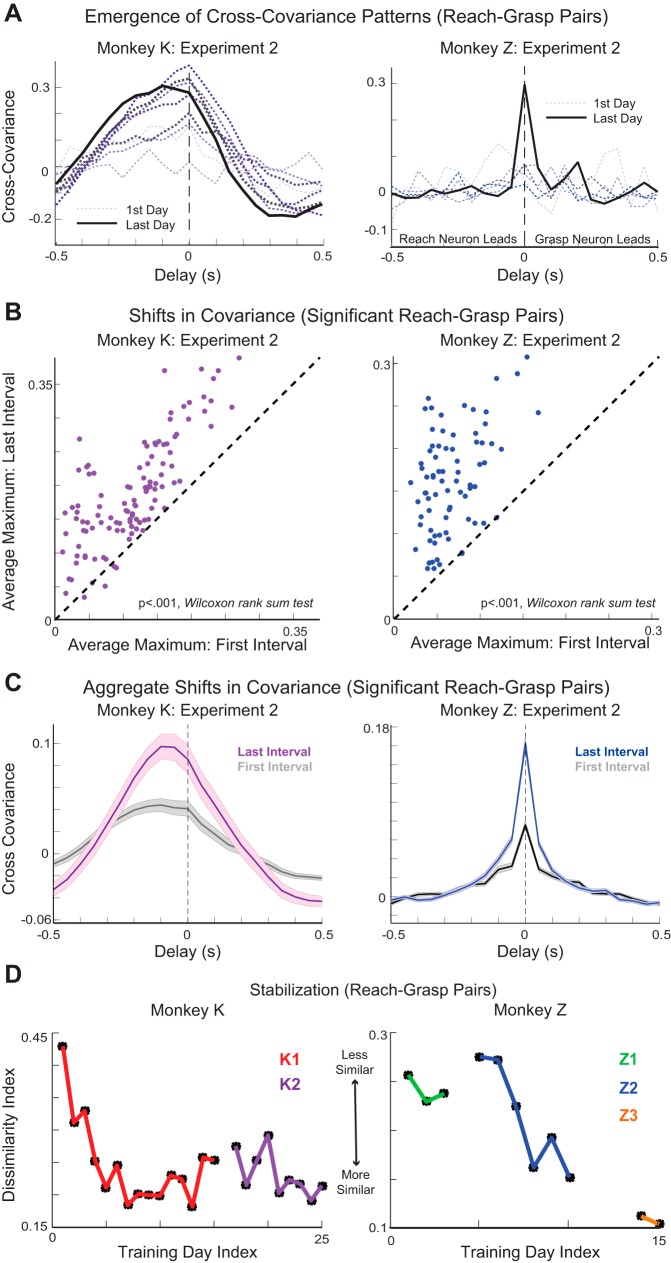
Fig. 4.
Cross-covariance patterns: reach-grasp neuron pairs. A: patterns of cross-covariance were observed to arise between pairs of reach and grasp neurons. Data are cross-covariance on the first day of a training experiment (thin, light gray dotted line) and cross covariance on the last day of a training experiment (thick black solid line) of an example reach-grasp pair for monkey K (left, purple gradient) and monkey Z (right, blue gradient). Color gradient from light gray through black along with line width indicates progression from first to last day of training experiment. B: positive cross-covariance extrema between the first and third intervals of a training experiment, plotted for pairs of reach and grasp neurons. C: average cross-covariance of significant reach-grasp pairs in the first (gray) and third (colored) intervals of an experiment for each monkey. Shaded areas represent SE. D: dissimilarity index. Data are Euclidean distances between the pattern of cross-covariance on every day and the average pattern over the 3 prior days of training.

