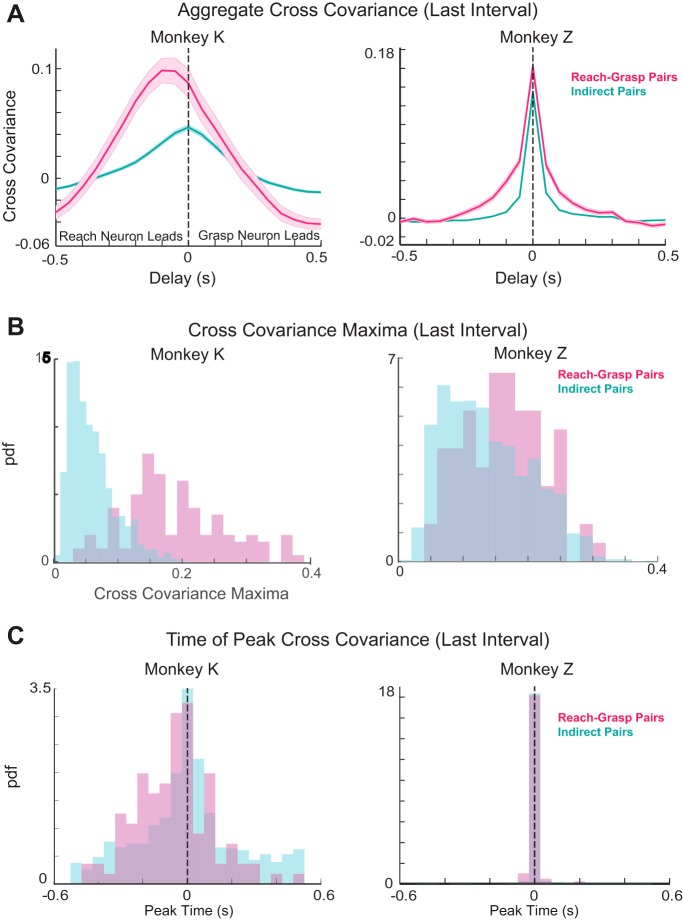
Fig. 6.
Ensemble comparison. A: average cross-covariance of reach-grasp neuron pairs (pink) and indirect neuron pairs (cyan) in the third interval of an experiment for monkey K (left) and monkey Z (right). B: distributions of the peak cross-covariance of the reach-grasp (pink) and indirect neuron pairs (cyan) in the third interval of an experiment for each monkey. C: distributions of peak cross-covariance times between reach-grasp (pink) and indirect (cyan) pairs in the third interval of an experiment for each monkey.

