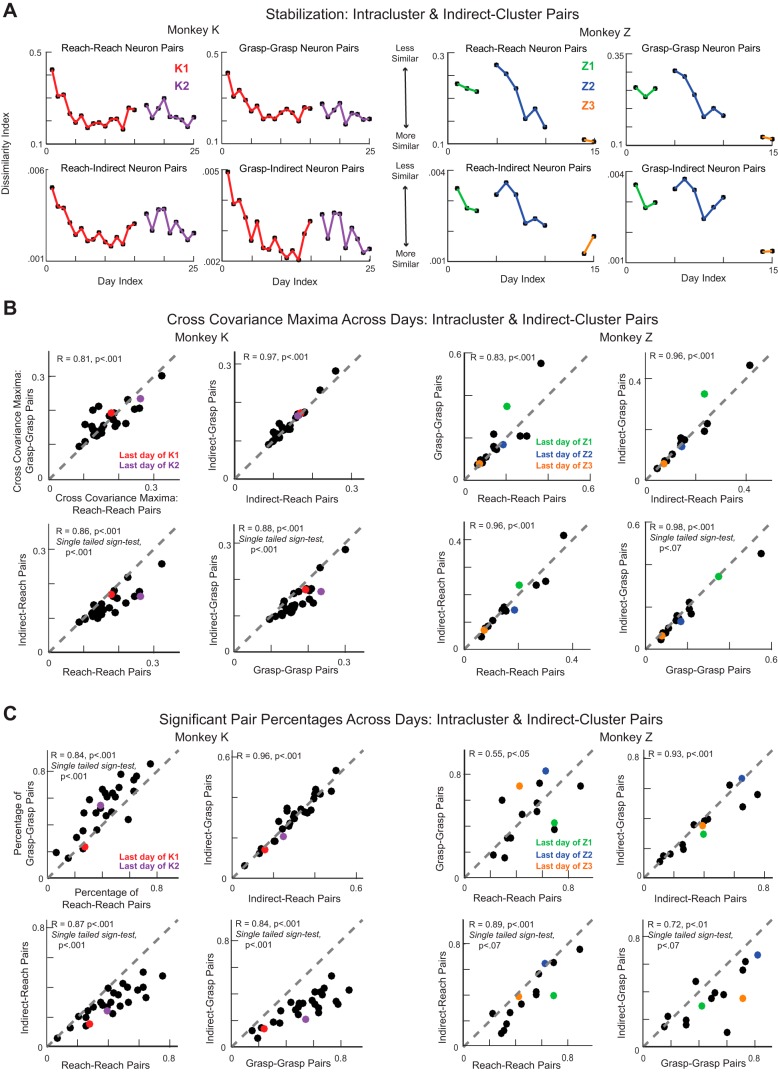
Fig. 8.
Broader network comparison. A: dissimilarity index. Data are Euclidean distances between the pattern of cross-covariance on every day and the average pattern over the 3 prior days of training for intracluster (reach-reach, grasp-grasp) and indirect-cluster (reach-indirect, grasp-indirect) neuron pairs for monkey K (left) and monkey Z (right). B: the median maxima of the cross-covariance patterns for each day of training for different types of neuron pairs plotted against one another. Colored points refer to the last training days in each experiment. C: the percentage of all potential pairs that showed significant extrema for each day of training for different types of neuron pairs plotted against one another. Colored points refer to the last training days in each experiment.

