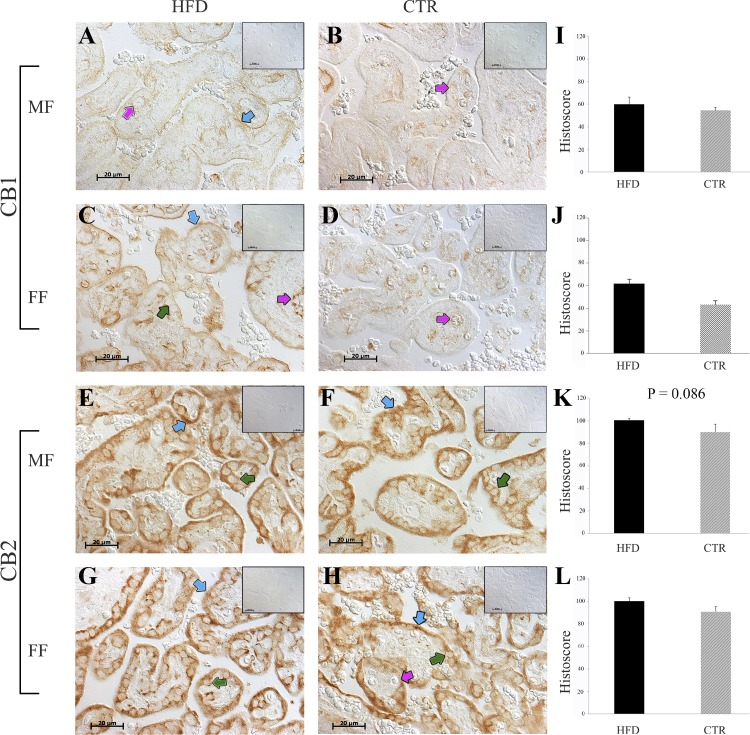
Fig. 4.
CB1R and CB2R protein expression in the placenta from high-fat diet (HFD; n = 10) and control (CTR; n = 11) animals. A, B, E, and F: placental expression of CB1R in male fetuses (MF). C, D, G, and H: representative images of the placental sections from female fetuses (FF). Blue arrows point to syncytiotrophoblasts, green arrows point to cytotrophoblasts, and pink arrows point to fetal capillaries. The negative controls (omission of the primary antibodies) are shown as insets (A–H, top right). Scale bar, 20 μm. I–L: immunohistochemical quantifications for the HFD and CTR groups. Data are presented as means ± SE.

